The National Council of Teachers of Mathematics (NCTM, 1991, 2000) advocates active methods to learning mathematics. Technology plays such an important role in today’s mathematical learning that The Technology Principle is one of the six principles listed in NCTM’s (2000) Principals and Standards of School Mathematics. This principal promotes the “appropriate and responsible use of technology” (p. 333) in the teaching of mathematics.
Garofolo, Drier, Harper, Timmerman, and Shockey (2000) presented guidelines for technology utilization by mathematics educators, teachers, and students based on the NCTM Principals and Standards. These guidelines include using technology in context, applying technology to meaningful problems, employing technology to improve pedagogy instead of replacing existing pedagogical techniques, and taking advantage of technology to connect various mathematical representations. Some of the excellent examples they present make use of spreadsheets.
Özgün-Koca (2003) outlined NCTM standards that can be tackled by using spreadsheets to teach mathematics. Chief among these are mathematical concepts of plotting, exploring functions, investigating relationships between different representations, and allowing reasoning uninhibited by calculations and mechanics. Spreadsheets are particularly adept at displaying multiple representations simultaneously, which is an advantage over most graphing calculators.
Today, many mathematics education preservice programs include at least one course in technology and its applications to education. These courses examine many excellent “canned” software applications and preplanned uses of spreadsheets. Forman and Steen (2000) defined their role with this succinct statement: “Technology enables students to study patterns as they never could before, and in so doing, it offers mathematics what laboratories offer science: a source of evidence, ideas, and conjectures” (p. 140). They further explained, “To a mathematician, a spreadsheet is just algebra playing on a popular stage” (p. 144).
This article aims to enhance mathematics teachers’ technology exposure by demonstrating methods to manipulate technology in ways that allow customization to fit their students’ needs and to understand the concepts at work in the operation of these tools. With these concerns and perspectives, this article is presented as a valuable tool for teacher educators of mathematics teachers, their preservice mathematics teacher education students, and in-service mathematics teachers.
Academics, educational organizations, and commercial concerns have contributed many lessons and suggestions for the use of spreadsheets to teach mathematics. To sample some of the online resources, see Lewis’s (2001) Web site, which lists many Web links to spreadsheet assignments, along with the NCTM principals and standards addressed. Typically spreadsheets are used to perform data analysis, to model realistic problems mathematically, and to display results in tabular and graphical fashion.
In the section of this article entitled, “Creating Dynamic Graphical Displays,” the spreadsheet (Microsoft Excel for Windows) is used as a development platform to create commercial quality active learning mathematics pedagogical tools. The spreadsheet allows the creator (i.e., typically teacher educators, in-service and preservice teachers) to create computer-based tools without the need for programming. In particular, creators can develop tools that allow the targeted audience to explore the connections between the symbolic representation of a function and its corresponding graphical representation.
The unique quality of these tools resides in the display of the symbolic function representation. This display is accomplished without use of programming characters for mathematical operators as is usually done in spreadsheets and most graphing calculators (e.g, “*” for multiplication, “/” for division, and “^” for powers). Tools can be created that allow exploration of the relationships between different functional representations mimicking the exact forms found in textbooks. All students need do is type a parameter in the symbolic representation of a function to observe instantly the corresponding change in its graphical representation.
Through these characteristics, preservice teachers learn the technology within the context of meeting the NCTM (2000) standards for algebra. In addition, teacher educators can choose to build their tool development lesson around creating a particular equation form that addresses some meaningful real world problem, as the technology is easily adaptable to many scenarios. The tools developed using this technique improve the symbolic function display over the display generally available with the current technology. These issues meet the technology guidelines of introducing technology in context, addressing worthwhile mathematics, using technology to improve pedagogy, and connecting mathematical topics and representations, specified in Garofolo et al. (2000).
The section of the article entitled, “Using the Spreadsheet Tools,” demonstrates use of these spreadsheet tools through five student activities that meet NCTM standards. These student activities reveal the potential of the tools. They can generate student interest, as they use mathematical concepts to control the graphical displays. As suggested by Garafolo et al. (2000), the primary users of the tools in these activities are the students, while teachers are responsible for setting up the tools. The sample activities address exploring mathematical concepts of slope and y-intercept in linear equations. The use of the tools allows students to “examine patterns and structures to detect regularities,” and the activity asks students to “formulate generalizations and conjectures about observed regularities” (NCTM, 2000, p. 262) between the symbolic and graphical functional representations (NCTM Reasoning and Proof Standard).
The last activity presented shows how students can employ the tools to solve for and explain the results to practical problems in accordance with the NCTM (2000) Problem Solving Standard. The section also provides a Web link where these spreadsheet tools can be downloaded. However, these activities provide only the beginning, for the same design techniques can be used to create other tools that demonstrate almost any mathematics concept that can be graphed.
A summary and future directions are describe in the last section of this article.
Creating Dynamic Graphical Displays
The process for creating dynamic graphical displays is given with the aim that mathematics teachers (preservice and in-service) with a better grasp of technology will be more likely to create (and employ) technology tools to enhance their students’ studies. Education professors can assign this tool design lesson to their preservice education majors as given. This lesson has been assigned to preservice mathematics teachers during their mathematics teacher education methods class at Longwood University.
The lesson presents step-by-step instructions with accompanying animations for each phase of development. The instructions describe how to create a dynamic tool that displays for a linear function a symbolic representation interrelated with the corresponding graphical representation. After these instructions, guidelines for modifying the instructions for use with nonlinear functions are presented, along with clarifying animations. In particular, an exponential function is used. The animations can be opened in separate windows so they can be viewed simultaneously with the written instructions or while working in a spreadsheet.
General Background
This tool design lesson utilizes Microsoft Excel 2000 for Windows; however, most spreadsheet programs provide the same command possibilities although the procedures for using them may vary. General spreadsheet knowledge is assumed concerning entering labels and formulas into cells, copying and pasting cells, resizing columns and rows, and formatting and aligning text. All other point-and-click techniques are explained and demonstrated. To augment or review these skills see Florida Gulf Coast University’s online Excel 2000 tutorial. (Editor’s Note: URLs for all Web sites can be found in the Resources section at the end of this paper.)
Tool Design Lesson
Before starting the lesson, it is necessary to turn off any pop-up blockers that may be installed in one’s Web browser. Most pop-up blockers provide a way to disable the feature temporarily for selected Web sites. As many different pop-up blockers are available, consulting with the particular pop-up blocker will help to determine how to disable it. Most major browsers come with their own built-in pop-up blockers. Also, JavaScript must be enabled within the browser for the animations to operate. Most browsers have JavaScript enabled by default, although some browsers have security features that require the user to enable this feature on each new Web site visited that employs JavaScript. This request usually appears directly below the browser address bar and when displayed may be accompanied with an audio warning. To begin the Tool Design lesson, go to http://www.longwood.edu/business/mathtools/tooldesignlesson.htm.
All of the spreadsheet tools discussed in this piece may be downloaded from the Longwood University Interactive Computer-Based Math Teaching Tools Download Page. There are four such tools, two using linear functions and two employing nonlinear functions. See Figures 1a, 3, and 4 in this article and Figure 6 located in the Tool Design lesson for snapshots of each tool. The linear tools model a straight-line function (Figure 1a) and simultaneous equations (Figure 4), while the nonlinear tools model an exponential function (Figure 6) and parabolic function (Figure 3). The tools were created using the techniques presented in the Tool Design Lesson and were tested both in Windows and on Macintosh computers. Although the tools operate on a Macintosh, formatting of the displays may be different. Using the Zoom command in Excel can resize the displays to fit one’s screen.
These tools are very user friendly. Each tool contains a symbolic function representation, a graphical function representation, and data points calculated from the symbolic function representation used for plotting the graph. The symbolic function representations are displayed exactly as shown in mathematics textbooks. That is, mathematical operators do not require use of corresponding programming symbols, as must be done with most graphing calculators and spreadsheet applications. This removes a level of translation required between the technology and the mathematics.
All that these tools require is for the user to directly change the coefficients in the symbolic display area. Then the graph automatically adjusts to reflect that change (see Figures 1a and 1b). Similarly, for the linear function tools, a change in data point values automatically transforms the graphical display of the function (see Figures 1b and 1c).
The spreadsheet protection allows the user only to change the function coefficient values and for the linear function tools the x coordinate values of the plotted data points (corresponding y coordinate values are calculated from the symbolic function representation). Figure 2 shows the warning that displays when attempting to change a protected cell. This protection keeps users from damaging the tutorial during experimentation.
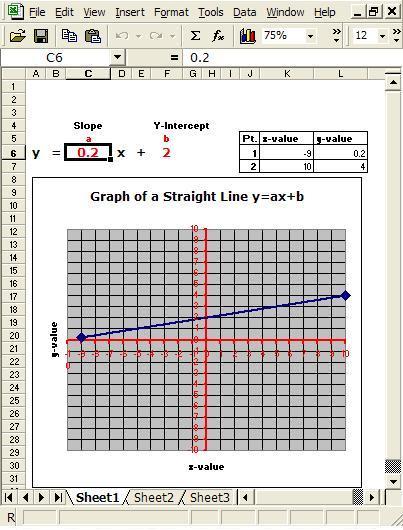 Figure 1a. Straight line with slope coefficient of 0.2.
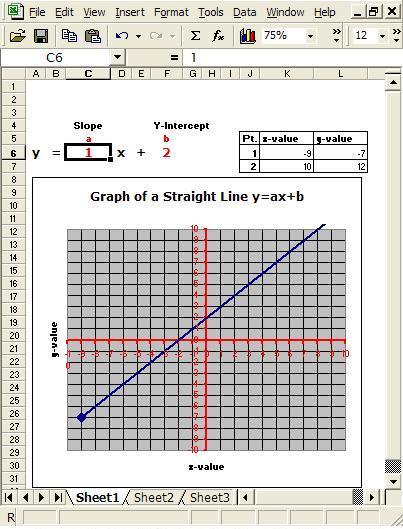 Figure 1b. Straight line with slope coefficient of 1.
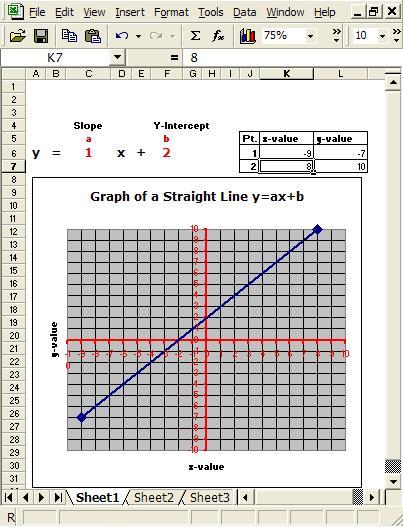 Figure 1c. Straight line with second endpoint back on graph.
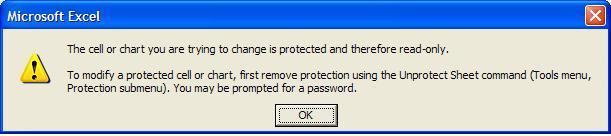 Figure 2. Protection violation warning.
Several activities using the linear tools demonstrate possible lesson plan topics that can be built around using these tools. These activities demonstrate the concepts of slope and intercept, and give a practical application of each concept. The activities strongly support the philosophies proposed in NCTM’s (2000) Principles and Standards for School Mathematics. They are structured to support the following NCTM strategies:
- Technology integration.
- Interactive learning.
- Concept-building through discovery.
- Actively building new knowledge from experience and prior knowledge.
- Discourse in mathematics.
- Formulate explanations.
- Mathematical literacy.
- Using modeling to solve problems.
- Making connections by investigating various models.
- Promoting mathematics as a tool for solving real life problems.
The activities are complete lessons as stated or they may be altered to fit individual needs. Take note that the activities progress sequentially using an interactive discovery approach, which promotes understanding and retention. Each activity is presented separately in worksheet format, which makes for easy printing and distribution. Both HTML and Word versions are available. The links that follow present the activity indicated. Many similar activities can be easily generated for the utilized tools or the other tools.
Activity 1 – The y-intercept (HTML, Word) – Explore how the value of the y-intercept parameter of the linear symbolic function representation changes the corresponding graphical model of the function.
Activity 2 – The Slope (HTML, Word) – Explore how the value of the slope parameter of the linear symbolic function representation changes the corresponding graphical model of the function.
Activity 3 – Determining Slope Graphically (HTML, Word) – Analyze the geometric properties of the slope within the graphical model and compare these graphical properties to the slope parameter of the symbolic function model.
Activity 4 – Determining Slope From Slope Formula (HTML, Word) – Use the slope formula to determine the slope of a linear function in a manner that illustrates the geometric properties of slope as determined in Activity 3.
Activity 5 – Practical Application (HTML, Word) – Demonstrate the practical value of slope and y-intercept in a real world situation.
Summary and Future Directions
This article introduced a series of spreadsheet tools that interactively connect symbolic and graphical representations of functions. Symbolic representations that are exact reproductions of the function notation found in textbooks are a unique feature of these tools. The tools were created using Microsoft Excel 2000 for Windows as a design platform. The tools conform to NCTM standards and the technology guidelines presented by Garafolo et al. (2000). The activities presented that use the tools were designed to support teaching strategies based on the NCTM standards.
The scope of these tools is limited only by one’s imagination. If a function can be graphed, a tool can be designed for it. Figures 3 and 4 show layouts for two other tools based on a parabola [y = a (x – h)² + k] and solving simultaneous linear equations, respectively. In addition, to give real meaning to these relationships and functions, the axis labels can be changed to reflect real-world quantities.
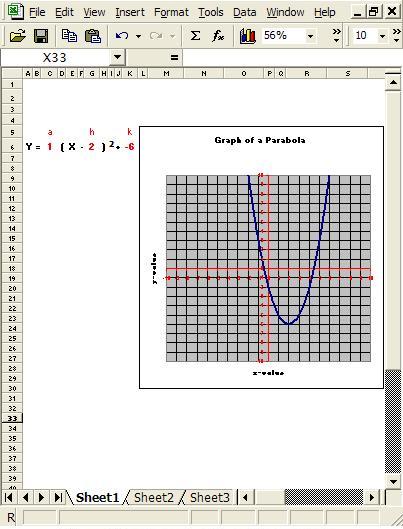 Figure 3. Dynamic chart of a parabola.
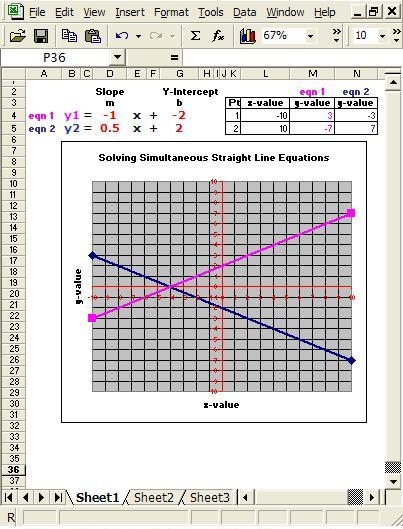 Figure 4. Dynamic chart of simultaneous linear equations.
These techniques are currently being used in the mathematics education methods classes at Longwood University. The authors have created a Web site where the four tutorials shown in this article may be downloaded (http://www.longwood.edu/business/mathtools/). Finally, the Web site contains directions for readers who would like to contribute tools created with these methods. They will be posted on the Web site for downloading.
References
Forman, S. L., & Steen, L. A.. (2000). Beyond eighth grade: functional mathematics for life and work. In M. J. Burke & F. R. Curcio (Eds.), Learning mathematics for a new century: NCTM 2000 yearbook. (pp. 140, 144). Reston, VA: National Council of Teachers of Mathematics.
Garofalo, J., Drier, H., Harper, S., Timmerman, M.A., & Shockey, T. (2000). Promoting appropriate uses of technology in mathematics teacher preparation. Contemporary Issues in Technology and Teacher Education, 1(1). Retrieved December 28, 2005, from https://citejournal.org/vol1/iss1/currentissues/mathematics/article1.htm
Lewis, P. (2001). Use spreadsheets to teach mathematics and meet standards. Paper presented at the National Educational Computing Conference, Chicago. Retrieved January 2, 2006, from http://www.angelfire.com/wi2/spreadsheet/necc.html
National Council of Teachers of Mathematics. (1991). Professional standards for teaching mathematics. Reston, VA: Author.
National Council of Teachers of Mathematics. (2000). Principles and standards for school mathematics. Reston, VA: Author.
Özgün-Koca, S. A. (2003). Using spreadsheets in mathematics education. (ERIC Document Reproduction Service No. EDO-SE-00-08). Retrieved January 2, 2006, from http://www.stemworks.org/digests/dse00-08.html
Excel 2000 tutorial – http://www.fgcu.edu/support/office2000/excel/
Interactive Computer-Based Math Teaching Tools Download Page – http://www.longwood.edu/business/mathtools/
Acknowledgements
The authors wish to thank the Longwood mathematics education students for their feedback on the tool creation lesson presented in this article. This feedback was used to improve the lesson.
In addition, the authors thank the editors of the Current Practices section for their many helpful comments and editing suggestions that enhanced this article.
Ronald F. McPherson
Longwood University
Farmville, VA
email: [email protected]
Velma Tyson
University of the Virgin Islands
Kingshill, VI
email: [email protected]
![]()