Science education reform documents specify that science instruction should actively engage students in developing conceptual understandings of key science concepts. Students should know about and practice inquiry and use this knowledge and experience to develop deeper understandings of how science impacts their everyday world (American Association for the Advancement of Science [AAAS], 1993; National Research Council [NRC], 1996).
Traditionally, teachers have emphasized lecture, text, and demonstration, with the intent that students would comprehend and recall this information at the conclusion of a unit or chapter. However, teachers practicing reforms-based instruction place less emphasis on these traditional approaches and greater emphasis on fostering inquiry in student-centered ways. Reforms-based instruction is based on flexible curricula, providing students with opportunities to construct scientific understandings through active learning. These shifts in instructional approaches are difficult because they require dramatic changes in practices that have persisted for a long time.
Johnson (2006) reported that 10 years after the National Science Education Standards (NRC, 1996) were published most teachers were still not practicing reforms-based science instruction. In many cases, teachers do not even have a basic understanding of what constitutes reforms-based instruction (Gess-Newsome, 2003). Implementing reforms-based instruction is made even more difficult by lack of content knowledge and inadequate understanding of science-specific instructional approaches (Loucks-Horsley, Hewson, Love, & Stiles, 1998). Finally, teachers often cite lack of resources, including both equipment and curriculum materials, as a barrier to implementing new instructional methods (Blumenfeld, Krajcik, Marx, & Soloway, 1994).
Recent investigations point to the potential of computer technologies in facilitating reforms-based instructional practices (Kim, Hannafin, & Bryan, 2007; Sandholtz, Ringstaff, & Dwyer, 1997). Digital images and video, computer probeware, online data access, and computer simulations have all been shown to help both students and teachers develop scientific conceptions of standards-based content (Bell, Gess-Newsome, & Luft, 2008; Flick & Bell, 2000). Furthermore, computer simulations have been shown to facilitate inquiry learning. For example, in a recent study of preservice teachers’ conceptions of lunar phases, researchers reported pre- to postinstructional gains in scientific conceptions of more than 80% for participants who used an astronomy simulation in the context of inquiry instruction (Bell & Trundle, 2008). In another recent investigation, Winn et al. (2005) found simulated data collection to be just as effective as field-based data collection in learning oceanography concepts. Furthermore, the computer simulation provided a model-based experience that offered visualization opportunities not possible in actual field work.
Despite the advantages that computers have to offer, research has consistently shown that few teachers use computers as instructional tools. For example, in a study of two high-tech high schools in California (Cuban, Kirkpatrick, & Peck, 2001) researchers found that over half the classrooms had a computer with Internet connectivity, yet lesson planning, finding resources, communicating with colleagues, and browsing the Internet dominated classroom computer usage. This pattern of usage was broken by only occasional instances of teaching or learning with computers. The researchers concluded that computers, while frequently used, had not significantly impacted classroom instruction and learning. Similarly, in his visits to schools across the nation, Pflaum (2004) found that computers were rarely used to facilitate and enhance instructional practice and more often were used for student and teacher productivity.
Why do classroom computers see such limited use as instructional tools? Certainly, one barrier is the lack of preparation to use the technology itself (Becker, Ravitz, & Wong, 1999). Researchers have posited that preparing science teachers to use educational technology in appropriate ways requires a multifaceted approach that includes subject-specific preparation, examples, and resources (Flick & Bell, 2000). Others have emphasized the interplay of three specific arenas of knowledge (content, pedagogy, and technology) as critical to successful teaching with technology.
Referred to as technological pedagogical content knowledge (TPCK; or, in some circles, technology, pedagogy, and content knowledge—TPACK), the construct reflects the complex, multifaceted, and situated nature of teacher knowledge that can lead to successful technology integration (Mishra & Koehler, 2006). Facilitating the development of such complex knowledge is no easy task and has proven to be a challenge to teacher preparation programs.
Exacerbating the difficulties inherent to learning to teach with technology is the lack of access to computers in schools. In one sense this assertion may be surprising, considering that billions of dollars have been spent on computers and the Internet in American classrooms over the past 15 years. Most US classrooms now have at least one computer with an Internet connection (Bull & Garofalo, 2004). However, students still have limited access to computer resources, with 68% of teachers reporting that they have either one computer to use in the classroom or limited access to a computer lab (Norris, Soloway, & Sullivan, 2002).
Although schools may have laptop carts and computer labs, these are often underused for a variety of technical and logistical reasons, resulting in the single-computer classroom persisting as the dominant model (Pflaum, 2004). Teachers in single-computer classrooms face substantial barriers when attempting to use their computer for instructional purposes. Using a single computer effectively to teach science in a classroom of 25 students is seldom practical or even possible.
One way to improve the instructional utility of a single computer in the science classroom is to provide a display visible to the entire class. Early attempts to improve visibility that utilized TV monitors were less than successful, due to the small size of the screen and the awkward placements required by the bulky CRT monitors (Irving, 2003). Once digital projectors became affordable, they quickly began to replace the TV monitor as large-scale computer displays for classrooms. Although many educators expressed concern that these displays would promote traditional teacher-centered practices, others speculated that the displays could facilitate reforms-based usage of computers by teachers with requisite TPCK (Bell & Garofalo, 2005).
In fact, preliminary investigations have shown that teachers who had access to computer projectors often used the technology for instructional purposes to promote student engagement and inquiry, even in a whole-class setting (Irving, 2003; McNall, 2004; Smetana & Bell, 2009). However, additional research is needed to characterize the instruction of teachers in single-computer classrooms, especially when these teachers’ preparation has been designed to facilitate their growth in TPCK and to use technology for instructional purposes in whole-class settings.
In the present investigation, 9 preservice biology teachers enrolled in a teacher preparation program designed to facilitate the development of TPCK were each provided with an Interactive Display System (IDS) during their student teaching semester. The IDS consisted of a computer with Internet access connected to a digital projector and an interactive white board. Participants in this study were issued a SMART Technologies brand interactive whiteboard, which allowed the teacher and students to manipulate interactive Web sites and applications from the whiteboard itself, digitally mark on the board, and save these annotations for later use.
The goal of the research was to characterize the ways in which these preservice teachers integrated the IDS into their science instruction throughout their student teaching experiences.
TPCK and Teacher Preparation
The instruction advocated in current science education reform documents is consistent with the TPCK construct. Both suggest that effective teachers are able to synthesize knowledge of content, pedagogy, and learners in ways that enable them to use available resources to teach science more effectively. Thus, teacher education that facilitates the development of TPCK has the potential to support reforms-based instruction.
Flick and Bell (2000) proposed a set of guidelines for teacher education that reflect both science education reform documents and facilitate the development of TPCK. These guidelines include the following:
- Technology should be introduced in the context of science content.
- Technology should address worthwhile science with appropriate pedagogy.
- Technology instruction in science should take advantage of the unique features of technology.
- Technology should be used in ways that make scientific views more accessible.
- Technology instruction should develop students’ understanding of the relationship between technology and science.
These guidelines place science content at the heart of learning to teach with technology, first emphasizing that teaching and learning the features of technology applications should be embedded within the context of meaningful science content. Second, activities incorporating technology should make meaningful connections to student experiences and foster student-centered, inquiry-based learning.
The third and fourth guidelines emphasize that technology should be used in ways that bring experiences into the classroom that would not otherwise be possible, such as making complex or abstract ideas more accessible to students through visualization, modeling, and multiple representations. The fifth guideline encourages teachers to take advantage of the context of technology in the classroom to teach about the interactions between science and technology. Together, these guidelines provide a framework for science teacher education programs wishing to promote the development of TPCK and reforms-based science instruction.
At the university that served as the setting for this investigation, preservice science teachers complete three courses structured on the Flick and Bell (2000) guidelines and designed to facilitate the development of TPCK. The first of these courses is a science/mathematics-specific educational technology course, in which preservice teachers are taught to use educational technologies through model lessons that address standards-based science content (see Ritt & Bell, 2009, for a detailed description of the course).
Next, the preservice teachers complete two science methods courses in sequence, each explicitly addressing technology integration in science instruction through explicit instruction and modeling of technology-specific pedagogical approaches. Preservice teachers also work together in groups to collect technology resources to support teaching in their subject areas, and they have multiple opportunities to practice teaching lessons in which technology is integrated, both in controlled class settings and in the field. Thus, the preservice teachers learn how to use educational technology in the context of science instruction, and they see examples of appropriate use and misuse of technology, as defined by the guidelines. This teacher education program has been shown to prepare science teachers successfully to use educational technology for inquiry learning, and to facilitate visualization, conceptual understanding, and student engagement (Irving, 2003; McNall, 2004).
Purpose
The purpose of this study was to explore preservice biology teachers’ use of an IDS during their student teaching experience. These preservice teachers were nearing the completion of a teacher education program designed to promote reforms-based instruction and facilitate the development of TPCK. The goal of the research was to characterize the ways in which these preservice teachers integrated the IDS into their science instruction and to determine whether their instruction with IDS supported reforms-based or more traditional methods.
Specifically, the study addressed the following questions:
- Will these preservice biology teachers use the IDS for instructional purposes?
- If so, in what ways will they use the IDS?
- Will their use of an IDS reflect reforms-based instructional practices?
Methods
This exploratory investigation followed a case-study approach. Therefore, our results and conclusions should be interpreted as preliminary findings that further our knowledge of the possibilities of IDS. They serve as a foundation for future research.
Participants
The participants in this study were 9 preservice biology teachers (6 female and 3 male) enrolled in a masters of teaching (MT) degree program at a large public mid-Atlantic university. Four participants had already received a bachelors degree in biology, while 5 participants were pursuing their bachelor of arts degree in biology concurrently with the MT. Participants ranged in age from 23 to 30 during their student teaching semester, and they all worked in public school settings under the guidance of a mentor classroom teacher. Participants were each working toward licensure to teach biology. Both the student teachers and their mentor teachers participated voluntarily in the investigation.
Sites
The 9 participants completed their student teaching placements in seven different public schools in the region surrounding the university. Table 1 presents the demographics of each of the schools represented in the study. The school names and participant names used throughout this paper are pseudonyms.
| Table 1 Site Descriptions | ||||
School | Location | Student Population | % Minority Students | % Free and Reduced Lunch |
| Carmel High School | Urban | 1,300 | 45% | 32% |
| Jefferson High School | Suburban | 1,100 | 23% | 20% |
| Mahopac High School | Rural | 788 | 13% | 18% |
| Mountain View Middle School | Suburban | 800 | 7% | 8% |
| Mountain View High School | Suburban | 1,000 | 7% | 8% |
| Patterson High School | Suburban | 1,600 | 16% | 12% |
The schools involved in the study were found in rural, suburban, and urban settings. School population ranged from 788 to 1,600, with an average of approximately 1,100 students. The percentage of minority students varied considerably based on location, with the rural and suburban schools showing less diversity than the urban school. The percentage of students receiving free and reduced lunch ranged from 8% in suburban areas to 32% in the one urban high school.
Details of the Teacher Preparation Program
Educational technology. All participants were required to take an introduction to educational technology course that provided an introduction to standards-based ways of integrating technology into science classrooms. Instructors modeled integration of educational technology in the context of meaningful content instruction. Special attention was given to identifying appropriate and inappropriate uses of technology in classrooms. Students developed in class a collection of resources they would be able to use during their student teaching experience and beyond.
Science methods courses. The participants also completed a two-course science methods sequence during the two semesters preceding student teaching. The instructional technology components of the class built on the foundation of the educational technology class. Both courses addressed specific models of science instruction and how educational technology could be integrated within these models.
Participants were also taught how to use an IDS and how inductive and inquiry models of instruction could be utilized in whole-class settings with an IDS. Examples of online simulations (which help make abstract concepts more concrete) were modeled for them, and they were shown how to engage students with digital images, videos, animations, and various examples of commercial software and resources on the Internet. In the lab component of the methods course, student teachers incorporated these resources with the projector and SMART Board to design and then teach practice lessons to their peers.
Student teaching and seminar. During the first semester of the second year of the master’s program, each participant completed a full-time student teaching experience in a public school setting under the direct supervision and guidance of a regular classroom science teacher. Each participant had access to a laptop computer, computer projector, and SMART Board for the duration of the student teaching semester, although they were not required to use the technology.
All of the participants in this investigation agreed to use the complete IDS. All participants were also enrolled in a student teaching seminar that met once per week for the entirety of the semester. The purpose of the seminar was to facilitate the translation of what was learned in the science methods classes into the student teachers’ own instruction in the classroom. The assignments and discussions encouraged reflection on the major goals and instructional approaches addressed throughout the program. The student teachers reflected upon and analyzed the effectiveness of their lessons, using specific examples from their teaching experiences.
Data Collection
A variety of data sources were used to characterize the preservice teachers’ instructional practices with technology. These data included formal and informal interviews, anecdotal notes from observed lessons, student teacher reflections, lesson plans, and other participant-created artifacts. A wide variety of data sources allowed the researchers to characterize fully each participant’s instructional uses of technology and to enhance the internal validity of our assertions through triangulation.
Interviews
The interviews included a formal entrance interview prior to student teaching, informal formative interviews during student teaching, and a formal exit interview at the conclusion of the student teaching experience. The initial interview was designed to discern participants’ thoughts about technology use, and document how they intended to integrate educational technology into their instructional practices during student teaching. These semistructured interviews, which were conducted at the beginning of the semester, lasted approximately 30 minutes and included 14 open-ended questions pertaining to content, pedagogy, intent for technology use, and beliefs about technology use. The interview protocol was reviewed and validated by a panel of three experts in the fields of science education, technology integration, and research design (Appendix A). All interviews were tape-recorded and transcribed for analysis.
Once student teaching began, the researchers periodically conducted informal interviews with each participant to determine their thoughts about technology integration. The questions focused on the student teachers’ thinking processes as they chose when and how to integrate technology into their lessons. They were also asked to reflect on the extent to which the technology impacted their students’ understanding of curricular objectives and their engagement with the subject.
At the conclusion of their 16-week student teaching experience, each participant was formally interviewed again, using a modified version of the entrance interview protocol (Appendix B). The semistructured exit interviews consisted of 20 questions and averaged approximately 50 minutes. The questions focused on how and why the participants integrated the IDS into their biology instruction. Additionally, the questions sought to elicit specific examples of successful and unsuccessful lessons integrating the technology.
Observations
The classroom observations constituted the primary source of data for characterizing how the participants used the IDS. We made an average of six observations per participant, for a total of 54 classroom observations. Each observation lasted approximately 90 minutes. Both authors and two additional graduate students completed these observations. Prior to conducting the observations, the second author trained the other observers as a way of standardizing the data collection.
First, reforms-based instruction and computer technologies that they might encounter were defined and described. Next, the observers conducted preliminary observations in controlled settings during which they practiced recording data and compared notes afterwards. During each of these practice observations, the observers took detailed notes with the goal of capturing lesson content and flow, student/teacher interactions, and detailed descriptions of the role (if any) that the IDS and other computer technologies played in the lesson. Only after they reached a high level of proficiency in recognizing technology usage and recording data did they begin collecting the observational data for this investigation.
Observations were scheduled in advance with each preservice teacher. Lesson plans, which each participant submitted 2 days in advance of teaching as part of the program requirements, were used as a source of information for planning which lessons to observe. Since one goal of the research was to characterize any instructional use of the IDS, the observers made an effort to schedule observations when lesson plans indicated that computer technologies would be a significant part of instruction.
This strategy skewed the classroom observations in favor of seeing the IDS in use, but these observation data were intended primarily to characterize the use of IDS in science lessons. Lesson plan analysis allowed us to assess the degree to which participants used the IDS. At least two of the six classroom visits for each participant were purposefully scheduled at times when computers did not appear to be central to the lesson. Thus, we were able to include more mundane uses of the IDS in which it did not play a central role.
Lesson Plans and Other Artifacts
Since we were not able to observe each lesson taught with a technology component, lesson plans and other teaching artifacts enabled us to assess the amount of IDS usage and to validate the statements made by the participants during their interviews. All lesson plans that the student teachers created and implemented throughout the semester were collected, totaling over 500 lesson plans. Additionally, all PowerPoint and SMART Notebook presentations were collected as valuable resources for analyzing how the participants’ instruction may have evolved over the course of 16 weeks. (SMART Notebook is free presentation software. Similar to PowerPoint, it has many features built in that take full advantage of the features of an interactive white board.) We also collected supplemental materials such as links used for Internet resources, handouts, labs, and assessment documents.
Reflections
As part of the student teaching seminar, each preservice teacher wrote four formal reflective essays over the course of the student teaching semester and at least five informal essays evaluating their lesson plans and classroom instruction. The formal reflections described the student teachers’ approach to and use of inquiry, their attitudes toward and use of educational technology, their understandings and implementation of the nature of science in their teaching, and their approach to classroom management. Participants’ formal and informal essays were collected to further characterize their instructional approach and use of IDS and other educational technologies.
Data Analysis
Data analysis followed an analytic induction process (as described by Bogdan & Biklen, 1992; Erickson, 1986). We used all available data, including initial and exit interviews, classroom observations, and various relevant artifacts generated by the participants during their student teaching experience. Prior to analyzing this data set, the two authors and a doctoral student analyzed data collected from one preservice teacher who was not a participant in this study. We compared results and discussed differences of opinion, then went back to the data set to reconcile and repeat the analysis until we reached agreement. We then independently examined data from 5 of the participants in this study, analyzed the data, then discussed the results of the analysis and revised our conclusions until agreement was reached. Thus adequately trained, the first author analyzed the entire data set from the 9 participants, examining each participant’s data for instances of instructional uses of technology with the goal of developing profiles for how each participant used the IDS.
The ultimate goal of the data analysis was to produce pedagogical profiles for each participant characterizing the way technology was used in each lesson. Profiles included the participants’ experiences reported in their interviews and corroborating evidence from their lesson plans and other artifacts.
Assertions were developed by searching the data corpus for common codes and coding themes, which in turn, were compiled into matrices (in the style of Miles & Huberman, 1994) to facilitate trend and pattern recognition across participants. After profiles were compiled, these patterns and trends were then used to develop preliminary assertions, which were further refined by comparing them to the original data sources. Several iterations of this process resulted in a manageable set of assertions, well supported by the data. Finally, a search was made for disconfirming evidence, and this information was used to further refine the assertions.
Analysis of the subset of lessons and lesson plans that specifically addressed science inquiry was informed by a framework for inquiry instruction (Bell, Smetana, & Binns, 2005). In this framework, any activity in which students are answering a scientific question through the analysis of data is classified as inquiry. For those activities classified as inquiry, the level of inquiry instruction is determined by the degree of student involvement in the inquiry process (Table 2.) Observed lessons or lesson plans in which students were involved in answering scientific questions through the analysis of data were classified as inquiry instruction, and then further categorized in regard to the level of inquiry. The degree to which the IDS played a role in the inquiry lesson/activity was also recorded. These data were then integrated into each participant’s instructional profile.
Results
The data analysis produced five assertions related to the preservice biology teachers’ use of the IDS. These assertions are presented with supporting evidence provided by representative samples from the participants’ lessons, plans, artifacts, and interview responses.
Assertion 1: Preservice teachers used the IDS to teach standards-based biology content.
The preservice teachers in this study relied heavily on the IDS for instructional use. In fact, most participants used their IDS nearly every day. An analysis of lesson plans revealed that use of the IDS for instruction ranged from 52% to 100% of all lessons with a mean of 76%. The student teachers used the display systems for projecting notes, visualization, information searches, directions, lesson hooks, and student engagement. They also used the IDS to make abstract concepts more concrete.
To accomplish these goals, the participants used a variety of technologies. In fact, every participant used the following technologies at least once: PowerPoint notes, simulations, animations, digital images, videos, digital diagrams and models, audio clips, Web sites, simulated labs, and digital microscopes. Additionally, they used the IDS to help them plan and organize their lessons. Primarily, they used the IDS to teach standards-based biology content.
Preservice teachers in this study used the IDS to teach a wide variety of biology topics with a wide variety of technological resources. For a general overview of the types of topics taught and the digital resources used to teach them, see Table 3.
| Table 3 Digital Resources Used For Biology Topics | ||||||
Biology Topic | PowerPointPresentations | Simulations & Animations | Images | Videos | Diagrams & Models | Web Sites |
| Biochemistry | X | X | X | X | X | |
| Cell transport | X | X | X | X | X | |
| Cells | X | X | X | X | X | X |
| Characteristics of life | X | X | X | X | ||
| Classification | X | X | X | X | ||
| Diffusion/Osmosis | X | X | X | X | X | X |
| Homeostasis | X | X | X | X | X | |
| Karyotypes | X | X | X | X | X | X |
| Kingdoms of life | X | X | X | X | ||
| Microorganisms | X | X | X | X | ||
| Mitosis/Meiosis | X | X | X | X | X | X |
| Nature of science | X | X | X | X | ||
| Organelles | X | X | X | X | X | X |
| Photosynthesis/ Respiration | X | X | X | X | X | |
| Scientific methodology | X | X | X | |||
Digital images were commonly used to illustrate important aspects of concepts in biology. Participants commonly used images that illustrated unfamiliar organisms (i.e., fungi, protists, and bacteria). Joey used a thermographic image of a spider to illustrate homeostasis (see Figure 1). Catherine used photos of parts of a microscope to show students how to use the parts properly. Gillian used an image of an insect resting on the surface of water to illustrate surface tension (see Figure 2). Jennifer used images of karyotypes to teach students about chromosomal abnormalities. Kelly used images of lithops to guide students through an inquiry into the characteristics of life (from the Web site, Living Stones Nursery and Plants for the Southwest ). (Editor’s Note: See Resources section at the end of this paper for URLs.)
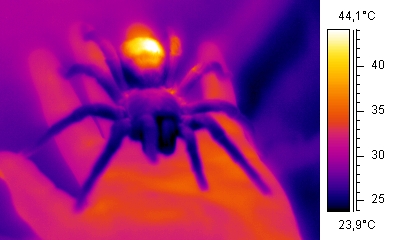
Figure 1. Thermographic image of spider (Source: Arno/Coen, 16 August 2006, GNU Free Documentation License; found at http://en.wikipedia.org/wiki/Image:Wiki_tarantula.jpg)
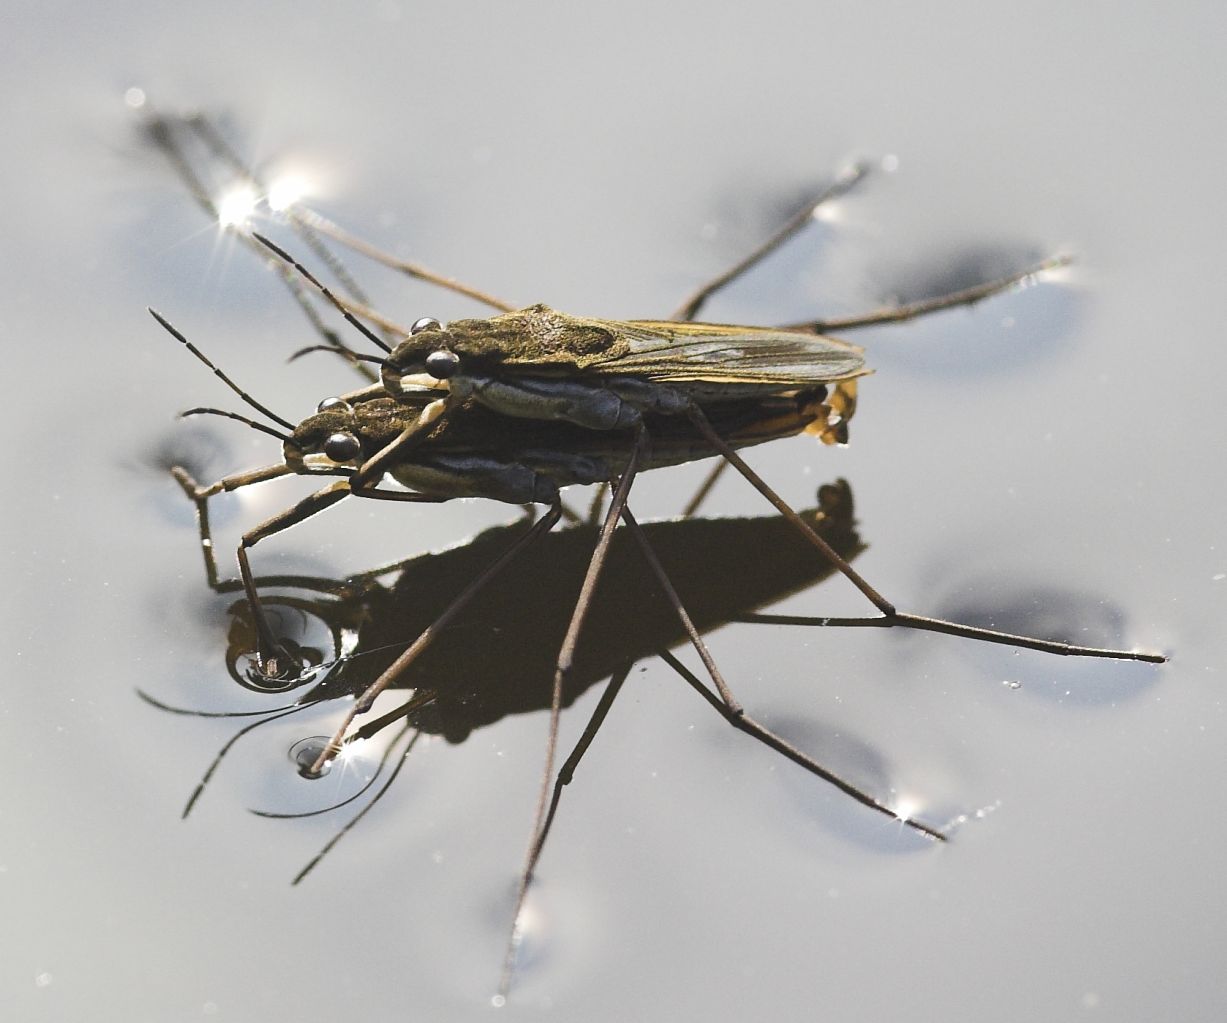 Figure 2. English Water striders using water surface tension when matingrfact ten (Source: Markus Gayda, 31 March 2005, published under the GNU Free Documentation License; found at http://en.wikipedia.org/wiki/Image:Wasserl%C3%A4ufer_bei_der_Paarung_crop.jpg )
The participants projected a number of images of cells to illustrate the wide variety of cell types, and they projected micrographs of cell structure, including organelles and chromosomes. Instead of using images merely for illustration, they used digital images to encourage interaction with the material. Students made observations and inferences, and the preservice teachers used the images as discussion prompts.
Jennifer was one of many preservice biology teachers in this study who taught students about karyotypes, the microscopic images of sorted and paired chromosomes. The example in Figure 3 describes a single teaching episode that illustrates the way in which many of the teachers used digital images to encourage students to make predictions and interpretations and ask questions about the material.
After a brief “do-now” lesson opener, Jennifer began her unit on the human karyotype. She said, “Today we are talking about genetic mutation and karyotyping. I personally think that this is where biology gets interesting!” She asked several students what they knew about karyotypes, then opened up a PowerPoint presentation which showed several different karyotype images with the digital projector. Jennifer asked students to look for chromosomal abnormalities in the karyotypes. Some karyotype images revealed an additional chromosome or a missing piece of a chromosome. She described the effects of chromosomal abnormalities on humans and projected some photographs of children affected with the disorders. Students asked questions about the karyotypes and chromosomal abnormalities. Jennifer then used a simulation called Matching up Chromosomes in a Karyotype to show students how homologous pairs are matched up. She used the SMART Board pen to drag chromosomes and circle homologous pairs. Students were excited to try their hand at matching up chromosomes, so Jennifer invited different students to come up to the SMART Board and drag chromosomes to their homologous pair. Students giggled and cheered one another on, as the class helped debate which chromosome the student at the board should choose. Jennifer then said, “OK, so now you’re starting to see what scientists do!” |
| Figure 3. Example 1 – Karyotypes |
Jennifer’s use of karyotype images helped her students visualize human chromosomes, molecular structures that would be very difficult to see through a low-powered microscope. The abstract concept that human cells contain chromosomes made of genes was made more concrete through these karyotypes and the photos of children with chromosomal abnormalities. Scientists create and use karyotypes to diagnose disorders, and Jennifer’s use of the karyotype simulation helped her students interact with the process themselves and mimic the process biologists undertake. Using the display system for visualizations was a theme that ran throughout all the participants’ teaching experiences.
Assertion 2: Preservice teachers used the IDS for inquiry-based science instruction.
The National Science Education Standards (NRC, 1996) stressed greater emphasis on student engagement and inquiry learning and less emphasis on the acquisition of disconnected information. When students are engaged in inquiry activities, they are answering scientific questions through the analysis of data (Bell et al., 2005). Although the participants were consistently observed teaching with hands-on activities and inquiry-based labs, we observed all participants engaging their students in inquiry activities through the use of the IDS. Most of these instances involved lower level inquiry, in that research questions and methods for answering the questions were provided by the teacher or implied by the simulation itself. There were instances of higher level inquiry activities with the IDS, as well, even in these whole-class settings.
The following examples describe some ways the participants implemented inquiry with the IDS. In order to capture the range of sophistication of these inquiry lessons, the examples reflect a progression from a simple activity to a complex inquiry activity.
Thomas used an online simulation to demonstrate the effect of temperature on enzyme activity (from the National Grid for Learning Cymru Web site ). He asked his students the question, “What is the effect of temperature on enzyme activity?” and they proceeded to use the simulation to collect and analyze data. When asked why he chose to use this particular simulation, he responded with three reasons: (a) he did not think this particular class (which consisted entirely of learning/behaviorally challenged students) had the self-control necessary to perform the activity themselves, (b) the simulation directly supported the specific concepts he wanted his students to understand, and (c) it allowed them to visualize at a molecular level. He said, “The simulation I found perfectly matched my objectives so I used it…. A demonstration would not illustrate what was happening on the molecular level like the simulation does.” This activity was categorized as structured inquiry (see Table 2).
Joey used online audio clips of crickets chirping from the Library of Congress Everyday Mysteries Web site during his unit on homeostasis. He challenged students to find a mathematical relationship between the crickets’ chirping frequency and the temperature of their surroundings. By collecting data from the audio files and analyzing it, students could interpolate temperatures from new audio files of chirping crickets. This simple inquiry activity resulted in straightforward answers that did not result in much debate. This activity was categorized as guided inquiry (see Table 2).
Vicki designed a more complex inquiry activity with the IDS. Much of this lesson, which focused on karyotypes, was similar to Jennifer’s karyotype lesson as described in Figure 3. However, Vicki expanded the lesson and had students apply their knowledge about karyotypes by investigating the scientific question, “What is the patient’s diagnosis?” (see Figure 4).
After several lessons on cell mitosis, Vicki used the simulation, Matching up Chromosomes in a Karyotype to show students how homologous pairs match up. She used the SMART Board pen to circle homologous pairs and asked, “So, when does a scientist want to take a picture of the chromosomes?” Because a previous lesson focused on cell division, one student confidently responded, “When they are dividing.” This response led to a discussion about abnormalities in chromosome formation and how this leads to specific genetic diseases. After this discussion, Vicki projected an online karyotyping activity from the Arizona University The Biology Project Web site and asked students to volunteer diagnosing patients based on their clinical symptoms and the digital images of their karyotypes. Each volunteer then came up to the SMART Board to read a patient’s history, complete the karyotype from a cell of the patient, and make a diagnosis. At the conclusion of the activity, Vicki reiterated how the process the students went through to diagnose the patients was similar to the way medical doctors diagnose genetic disorders. |
| Figure 4. Example 2 – Diagnosing patients. |
Vicki’s inquiry lesson involved a higher level of sophistication because students were answering questions that did not have obvious or straightforward answers. In the process of making their diagnoses, the whole class debated the interpretation of the available data and tried to reach consensus. In the end, the focus was not on whether the diagnosis was correct, but whether it fit the available data.
Kelly used the IDS to engage her whole class in an inquiry activity designed around a Word document. The document was projected onto the SMART Board, although it could have been projected onto a screen. It contained nine images and questions about mysterious objects called lithops, which looked like colorful, mottled rocks. Kelly also included a microscopic image of a slice of a lithop in the document. As she scrolled down the Word document, students saw different images of the objects and made observations and inferences to answer the question, “Are lithops living things?” In her Inquiry Reflection, Kelly wrote,
The first lesson I taught with inquiry was an introduction to the Nature of Life unit. I showed the students different pictures of lithops… The students were using skills such as observing, questioning, analyzing, inferring, and predicting. They were also drawing from past experiences and knowledge to come to their conclusion. This lesson sparked an interest in the students. Because I refused to tell them the answer to the question “Are lithops living things?” many of the students went home and looked them up on the Internet, asked their parents, and looked in the reference book in the library. Because the students were involved in the process of discovering if lithops were alive, they were very curious to know if they were right or not.
The level of inquiry for this activity was categorized as level 2, structured inquiry. Although this level is low, the activity involved students in debate and discussion, because it had no single straightforward answer. Engaging students in scientific debate and discussion is one of the major goals for K-12 science emphasized in the National Science Education Standards (NRC, 1996).
Inquiry teaching methods are emphasized throughout the science methods coursework, modeled by instructors with the IDS, and practiced by preservice teachers prior to their student teaching semester. As a result, the students developed a degree of familiarity and confidence in incorporating whole-class inquiry with the IDS. Thomas found that the IDS helped him lead inquiry lessons even with his lower academic-level students who were not yet capable of working independently.
I feel confident that I can perform successful inquiry lessons using computer simulations now. Performing inquiry in other contexts will, I suppose, not be all that different. I feel I have a good grasp of what inquiry is and what an inquiry lesson looks like, whether it’s a simulation, a webquest, an experiment, or whatever. I will definitely incorporate as much of it as I can into my teaching in the future. After all, what is science at its core except one big “?” (Thomas, Inquiry reflection)
Assertion 3: Preservice teachers used the IDS to help make abstract biology concepts more concrete.
Preservice teachers often used animations, simulations, and digital images to help make abstract concepts more concrete. The role of the IDS in these lessons ranged from providing a method to project the images/animations to providing opportunities for students to manipulate simulations in the whole-class setting. For example Catherine liked using Brainpop videos to help engage her students and introduce new concepts. She would often refer back to the videos during instruction. When teaching about cell transport, Catherine said that it gave her students “a non-linguistic representation of how molecules are transported through the cell membrane.” Gillian used the IDS to project and manipulate an interactive simulation during a biochemistry unit.
I did in fact use more computer gizmos during my biochemistry unit, as it encompassed a lot of concepts that are hard to visualize for students. [I used] a simulation showing the difference between ionic and covalent bonds, video clips demonstrating water’s important properties, a video showing how the enzyme substrate complex works, and an ExploreLearning gizmo that allowed students to experiment with testing the pH of various household substances. (Gillian, Technology reflection)
While teaching an introductory unit on cells to her seventh-grade students, Kelly used several simulations to demonstrate how osmosis functions in hypertonic and hypotonic solutions. Kelly wanted her students to be able to visualize osmosis at the cellular level before they did a lab activity with actual cells. The example in Figure 5 describes a single teaching episode that illustrates how many of the student teachers used simulations to teach abstract science content.
| After a class discussion about high and low concentration of a solute in solutions, Kelly had her seventh-grade life science students draw high and low concentrations with colored pencils on paper. They began to act restless. Next, she projected a set of osmosis simulations (found at www.tvdsb.on.ca/westmin/science/sbi3a1/Cells/Osmosis.htm) onto the SMART Board, and students stopped fidgeting and became very excited and interested. The first simulation, as illustrated in Figure 6, showed water molecules leaving a cell when surrounded by a hypotonic solution. The next showed water molecules entering a cell when surrounded by a hypertonic solution. The students were enthralled by the action of the water molecules and the changing shape of the cell membrane. They asked her to play the simulations over and over again. “It breaks?” one girl remarked excitedly when she saw the swollen cell membrane burst. |
| Figure 5. Example 3 – Osmosis. |
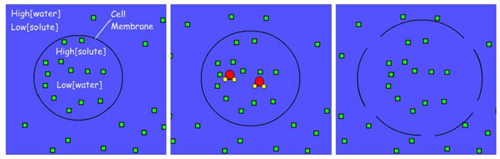
Figure 6. Cell swelling in a hypotonic solution as water molecules enter. (From Brown, 1999. Reprinted with permission of the author.)
Osmosis of water through a cell membrane can be difficult to see, but it is even more difficult to understand. Most middle school students cannot comprehend why water “wants” to go into a cell sometimes and out of it other times. Kelly’s use of a cartoon-like simulation helped her students visualize repeatedly the abstract relationship between solute concentration and osmosis.
After this lesson, the interviewer asked her why she did not use microscopes to let students see osmosis acting on actual cells. She responded, “If they don’t visualize it in a cartoon sort of way…they don’t really understand it…. I think I would show that after I showed the simple simulation first….It’s the second step.”
The next class day, she indeed followed the simulation with a lab that had students perform a hands-on activity with red onion epidermis. They created a wet mount of a small piece of red onion epidermis, then after viewing the cells with a microscope, added saline solution by drawing the water under the cover slip using a paper towel on the other side to absorb the fluid. The cells shriveled up as they lost water, and Kelly stated that she hoped that the students were remembering the simple simulation to help them understand why.
Assertion 4: Preservice teachers’ use of the IDS evolved over the course of their student teaching experiences.
All of the participants regularly used the IDS to facilitate note-taking and convey information such as laboratory procedures and safety rules. Typically, these notes were conveyed as PowerPoint presentations, which early in the semester consisted primarily of textual notes. Gradually, they added more interactive components, such as digital images, animations, and links to simulations as their experience teaching with the IDS progressed.
The mentor teacher typically exerted a great deal of control in the beginning of the student teaching placement, so that early lessons created by the preservice teachers usually followed the content outlines, general approach, and activities of the mentor teacher. Some mentor teachers emphasized note-taking from overhead transparencies, and early in the semester the preservice teachers were compelled to deliver the content through a deductive approach that emphasized giving notes didactically.
Some of the mentor teachers already used a digital projector to project PowerPoint presentations prior to the student teachers’ arrival. Student teachers in these classes typically started out by using their mentor teachers’ PowerPoint presentations, even though these presentations often heavily reflected didactic instruction and note taking. As the semester progressed and the preservice teachers gained greater autonomy in teaching, they branched away from their mentor teacher’s approach. Some used PowerPoint notes instead of overhead transparency notes or expanded the use of PowerPoint to include more digital images, and they made the images a more integral, interactive part of the lesson. Figures 7 and 8 illustrate such a modification of just one slide from a mentor teacher into four separate slides. Jennifer took the concepts of fission, budding, and fragmentation and brought them to life with examples, digital images and diagrams.
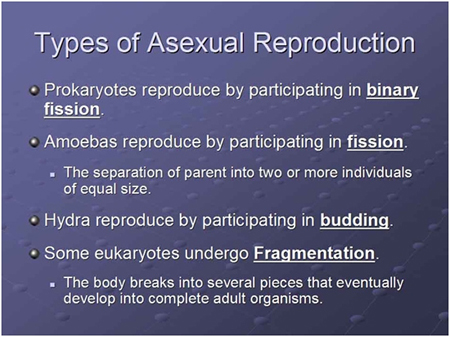
Figure 7. Mentor teacher’s slide on asexual reproduction.
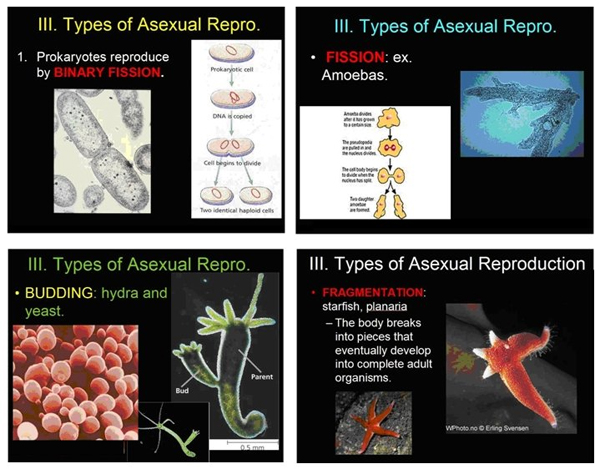
Figure 8. Jennifer’s modified slides on asexual reproduction.
Eventually, the preservice teachers started including links to online simulations, Web sites, videos, and sound files, providing a more engaging, interactive method of teaching the content through PowerPoint. They also began to develop a comfort level with using the Internet as a research tool on the spot when students had questions, or when a teachable moment occurred.
Ultimately, SMART Board usage became more natural and interactive, as the teachers started using the board for more than just advancing slides. They used the features of the board to highlight items, they browsed the Internet with their finger-as-mouse, and they invited students to come to the board and interact with it as well.
For example, at the beginning of her student teaching semester, Catherine was uncertain about how she would use the IDS technology in her instruction. She said in her entrance interview, “I can see it as an opener. I guess I can see using it in all parts differently. I don’t know.”
As time went by, she began adding more digital images, diagrams, and interactive questions to her PowerPoint presentations. She remarked, “I think in the beginning of my student teaching I was using PowerPoint, but not including as many animations or models or Gizmos, or even checking for understanding…”
Toward the end of the semester, Catherine developed an interactive and engaging SMART Board activity using the SMART Notebook software. She used the cloning tool to place images of the building blocks of macromolecules at the top of each slide: glycerols, fatty acids and monosaccharides, and so forth. (see Figure 9). She had students go up to the SMART Board and drag down what they needed to build particular macromolecules then touch a button to see the correct configuration. Catherine felt that this lesson was her most successful. She moved from text-only PowerPoint notes to presentations with engaging material embedded in interactive presentations that literally had students up out of their seats.
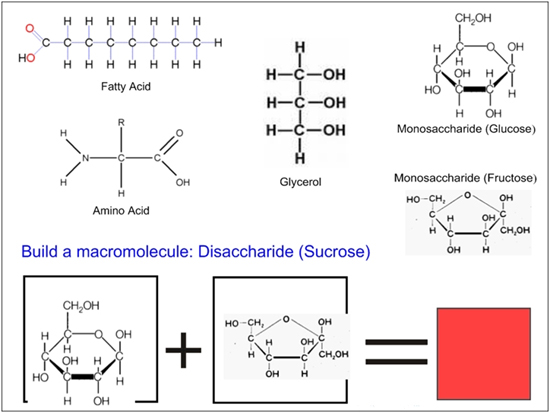 Figure 9. Catherine’s challenge questions about macromolecules.
Assertion 5: Preservice teachers, at times, failed to use the IDS in pedagogically appropriate ways.
Assertions 1-4 paint a picture of how the preservice teachers in this study used the IDS to teach science in engaging, stimulating ways. In general, we observed the teachers using digital resources to elicit discussions and debates about science and lead interactive and inquiry-based lessons through their use of the IDS. On the other hand, we observed several occasions when the preservice teachers either misused the IDS or did not use the systems at all when there was a good opportunity to do so. Missed opportunities were noted when a participant did not use a resource that was discussed or shared in class prior to the student teaching semester.
Using technology improperly (misuse) took two forms: technical misuse and pedagogical misuse. Technical misuse occurred, for example, when the student teachers inserted digital images in their presentations but did not make them clear or large enough to see. Additionally, student teachers may have selected and implemented videos, but they were too small or the volume was too low for students to fully experience the content. PowerPoint slides may have used colors with poor contrast or with font sizes too small to see from the back of the room. This misuse also occurred when they wrote on the SMART Board with a pen color that blended into the background color of the slide.
Pedagogical misuse occurred when the participants chose resources that were not relevant to the content, or did not fully engage students with the resource, for example, by not encouraging them to make predictions and hypotheses during the use of a simulation. Other illustrations of this assertion occurred when student teachers did not give students an advance organizer before showing an animation to help them understand what they were about to experience or did not discuss or analyze the animation afterwards. This assertion could also be characterized by teachers failing to discuss or analyze a particular digital image with the students. Pedagogical misuse also occurred when teachers used uninteresting images or clip art with no instructional purpose. This form of misuse did not enhance the lesson and often detracted from the instructional objectives.
The student teaching experience certainly was a time for the participants to experiment with different instructional approaches, make mistakes, and consistently reflect on their teaching. Incidences of improper use of the IDS decreased as the participants became more comfortable with the technology resources available to them and integrated feedback from their students, mentor teachers, and supervisor.
Conclusions and Discussion
The purpose of this study was to explore preservice science teachers’ use of an IDS to support science teaching and learning. Careful analysis of a variety of data sources including lesson plans, interviews, and extensive classroom observations allowed for triangulation and permitted us to answer the research question with a high degree of confidence. In this section we will summarize our findings and discuss the implications of the results.
Question 1: Will Preservice Science Teachers Use Computers for Instructional Purposes When Given an IDS?
In previous work that looked at how teachers used computers in real classrooms, results have been disappointing (Baure & Kenton, 2005; Cuban, 2001; Cuban, Kirkpatrick, & Peck, 2001; Pflaum, 2004, Shamburg, 2004). Teachers used computers for administrative purposes such as taking roll, recording and calculating grades, generating grade reports, and communicating with parents via email. Teachers also used computers at home for such things as lesson planning, finding resources, and communicating with other teachers.
Students use computers extensively outside the classroom. They write papers, use the Internet to look up information, and communicate with friends through social networking software (i.e., email, Instant Messaging, Facebook, MySpace). Students download music, play online games, and watch and share movie clips (YouTube, Google Video).
Thus, the main players in the classroom (teachers and students) know how to use computers and find them beneficial in their daily lives. However, research has shown that computers are not being used to their potential for instructional purposes in the classroom by either teachers or students.
The results of this study indicate that participants used the display systems for lesson planning, searching for resources, and for administrative purposes, but they all used the IDS for instructional purposes, too. Seven of them used it for more than 70% of lessons, teaching meaningful biology content. The participants did not require any incentives or encouragement to use their IDS to this degree. Placing the IDS in the hands of these student teachers, who had not only grown up using computers and the Internet but had been specifically prepared to integrate digital resources in their instruction, resulted in consistent and substantial use of computer technologies to enhance their biology instruction.
Question 2: What Will Instruction With the IDS Look Like?
Through classroom observations, interviews, and analysis of written reflections, we found that each participant used the IDS to plan and implement science instruction in ways that went beyond traditional practices. For example, when the student teachers talked about planning, they cited looking for Internet resources as a primary starting point. Although their textbook or mentor teacher typically provided the content structure for the units they taught, computer resources such as digital images, video clips, and simulations provided the means for teaching the content creatively.
Easy access to extensive libraries of digital images and video resulted in these student teachers’ making regular use of such resources to enhance their lessons. Early on, uses of images and video tended to be supplemental to instructional goals and served to make lessons more interesting but not necessarily more effective. With regular use, the participants learned to integrate Internet resources into the very heart of the lesson, often supporting such process skills as making observations and inferences, analyzing data, and supporting conclusions. Additionally, using computer simulations to support inquiry instruction became more prevalent. These high-end uses of the IDS did not occur every day but happened often enough to indicate that the IDS influenced the participants’ instructional practice. Clearly, the IDS provided a way for the student teachers to take advantage of digital and Internet resources in a single computer classroom for whole-class instruction and active student engagement.
On the other hand, the preservice teachers’ use of the IDS mimicked traditional instructional practices, as well. We observed all of the teachers delivering class notes with the IDS in exactly the same way they would have used an overhead projector. We observed teachers posing warm-up problems at the beginning of class using the IDS, much as they would have on a chalkboard. These uses, while practical, did not change the lesson content or instructional approach in any subsequent way.
Question 3: In What Ways (if any) Will Preservice Teachers Use the IDS to Support Reforms-Based Instruction?
Science education reform documents specify that science instruction should actively engage students in developing conceptual understandings of key science concepts (AAAS, 1993; NRC, 1996). Teachers practicing reforms-based instruction place greater emphasis on approaches that foster active learning and emphasize understanding of inquiry processes. The teacher’s focus is on facilitating understanding in response to individual students’ interests and needs, as well as giving students opportunities to work cooperatively, and to discuss and debate scientific ideas.
Although previous research has emphasized the difficulty teachers have in employing such reforms-based instruction (e.g., Johnson, 2006; Gess-Newsome, 2003; Loucks-Horsley et al., 1998), we often observed the participants in this study using the IDS to implement instructional approaches consistent with current science education reform documents. For example, the student teacher participants used the IDS to make scientific content more relevant to students by linking it to current articles, images, and video. The student teachers often engaged their students in making observations and inferences about digital images displayed with the IDS.
Additionally, more than half of the participants implemented inquiry instruction with the IDS, most often through the use of online simulations that allowed students to manipulate variables, test predictions, and “see” phenomena (such as cellular processes) that would otherwise be impossible to observe. The student teachers also used the IDS to present data for students to analyze and discuss and to present socioscientific issues designed to engage their students in discussion and debate about the implications of science for society.
We did not see examples of reforms-based instruction with every participant every day. However, the fact that these beginning teachers were experimenting with such instruction at an early stage in their careers is significant. Teachers’ pedagogical content knowledge requires time to develop as novice teachers transition into the complex role of teaching (Mullholland & Wallace, 2005). Also significant is the fact that when they attempted reforms-based instruction, it was often implemented with the IDS. Thus, we draw the tentative conclusion that access to the IDS facilitated their efforts to implement reforms-based instruction very early in their teaching careers.
In addition to the successes, we observed several pitfalls in student teachers’ attempts to integrate the IDS in effective ways. Creswell and Miller (2000) stressed that validity in a qualitative study is strengthened when researchers go through the difficult process of searching for evidence that disconfirms their assertions. Misuse of the IDS included projecting PowerPoint slides that consisted mostly of text and notes for students to copy and presenting digital images as simple add-ons that did not support instructional goals. The participants were also observed showing video clips with no real purpose and with little attempt to engage students beyond simply watching without thinking about what they were seeing. Finally, several participants were observed demonstrating simulations, rather than involving students in forming and testing hypotheses or predictions. However, these misuses of the IDS diminished over time as the student teachers became more confident in their abilities to manage the classroom environment and facilitate student learning.
The results of this investigation may inform the content and instructional approaches used to introduce preservice teachers to interactive display systems in educational technology and science teaching methods courses. For example, it is important to teach specific approaches for using digital images effectively, including having students record observations about what they see and infer what will happen next (Bell & Park, 2008). Instructors should model effective use of video clips, including providing advance organizers to help students comprehend what they see and how it is connected to the content they are learning and pausing video clips to ask questions or to point out specific features.
The Development of TPCK
Schulman (1986) introduced the idea that a teacher’s content knowledge and pedagogical skills intersect and should be addressed simultaneously. With the advent of computer technology, both the pedagogical skills and technological content knowledge of the teacher play a role whenever computer technology is used in the classroom (Mishra & Koehler, 2006). TPCK is the intersection of content knowledge, technological knowledge and pedagogical knowledge. Merely knowing how to teach a particular subject is not enough, nor is merely knowing how to use educational technology. Effective teaching considers the relationship between all three components. Developing TPCK is difficult for new teachers or new users of technology because of the extra demand it places on them. The participants in this study were part of a teacher preparation program that supported the development of TPCK, in that it included explicit instruction for using computer technology to support reforms-based science instruction.
Preservice science teachers in this study were encouraged to develop TPCK through coursework and support systems that followed the guidelines developed by Flick and Bell (2000). Technology was introduced in science methods classes. Students developed and shared technology resources specific to their content areas prior to student teaching. Unique features of the IDS were highlighted and modeled by instructors in their coursework. Scientific ideas and views were integrated into coursework through appropriate educational technology. Finally, preservice science teachers were taught to appreciate and understand the connections, interactions, and differences between science and technology.
Preservice teachers will not use educational technology for reforms-based teaching merely because they have technological skills—that is, technological content knowledge. Preservice teachers must learn how TPCK can facilitate various models of reforms-based instruction (Bell & Smetana, 2008). Ideally, preservice teachers should be given opportunities to practice implementing reforms-based science teaching with the IDS prior to student teaching. Student teachers will also likely require consistent feedback about how better to use computer technology over the course of their student teaching experiences.
The results of the study demonstrate how student teachers used a relatively inexpensive IDS to support reforms-based instruction in the single computer classroom. The findings are significant in light of the increasing availability of computer projectors in classroom settings. Although the results of this case study should only be generalized to other settings with caution, they support future efforts to investigate the use of an IDS to support science instruction and learning.
References
American Association for the Advancement of Science. (1993). Benchmarks for science literacy. New York: Oxford University Press.
Bauer, J., & Kenton, J. (2005). Toward technology integration in the schools: Why it isn’t happening. Journal of Technology and Teacher Education, 13, 519-546.
Bell, L., & Park, J. (2008). Digital images and video for teaching science. In R.L. Bell, J. Gess-Newsome, & J. Luft (Eds.), Technology in the secondary science classroom. Arlington, VA: NSTA Press.
Bell, R.L., & Garofalo, G. (2005). Projecting science and mathematics. School Science and Mathematics, 105, 48-51.
Bell, R.L., Gess-Newsome, J., Luft, J. (Eds.) (2008). Technology in the secondary science classroom. Arlington, VA: NSTA Press.
Bell, R.L., & Smetana, L. (2008). Using computer simulations to enhance science teaching and learning. In R.L.Bell, J. Gess-Newsome, & J. Luft (Eds.), Technology in the secondary science classroom. Arlington, VA: NSTA Press.
Bell, R.L., Smetana, L., & Binns, I. (2005). Simplifying inquiry instruction: Assessing the inquiry level of classroom activities. The Science Teacher, 72(7), 30-33.
Bell, R. L., & Trundle, K.C. (2008). The use of a computer simulation to promote scientific conceptions of moon phases. Journal of Research in Science Teaching, 45(3), 346 – 372.
Becker, H.J., Ravitz, J.L., & Wong, Y. (1999). Teacher and teacher-directed student use of computers and software (Report No. 3). Retrieved from the Center for Research on Information Technology and Organizations Web site: http://www.crito.uci.edu/tlc/findings/computeruse/html/startpage.htm
Blumenfeld, P.C., Krajcik, J.S., Marx, R.W., & Soloway, E. (1994). Lessons learned: How collaborations helped middle grade science teachers learn project-based instruction. The Elementary School Journal, 94, 539-551.
Bogdan, R.C., & Biklen, S.K. (1992). Qualitative research for education. Boston: Allyn & Bacon.
Brown, T. (1999). Osmosis. Retrieved from the Westminster Secondary School Science Department Web site: http://www.tvdsb.on.ca/westmin/science/sbi3a1/Cells/Osmosis.htm
Bull, G., & Garofalo, J. (2004). Internet access: The last mile. Learning and Leading with Technology, 32(1), 16-18. (ERIC Document Reproduction Service No. EJ695791).
Creswell, J.W., & Miller, D.L. (2000). Determining validity in qualitative inquiry. Theory into Practice, 39, 124-130.
Cuban, L. (2001). Oversold and underused: Computers in the classroom. Cambridge, MA: Harvard University Press.
Cuban, L., Kirkpatrick, H., & Peck, C. (2001). High access and low use of technologies in high school classrooms: Explaining an apparent paradox. American Educational Research Journal, 38, 813-834.
Erickson, F. (1986). Qualitative methods in research on teaching. In M. Wittrock (Ed.), Handbook of research on teaching (3rd ed.; pp. 119-161). New York: Macmillan.
Flick, L., & Bell, R. (2000). Preparing tomorrow’s science teachers to use technology: Guidelines for science educators. Contemporary Issues in Technology and Teacher Education [Online serial], 1(1). Retrieved from https://citejournal.org/vol1/iss1/currentissues/science/article1.htm
Gess-Newsome, J. (2003, April). Implications of the definitions of knowledge and beliefs on research and practice in science teacher education. Paper presented at the annual meeting of the National Association for Research in Science Teaching, Philadelphia, PA.
Irving, K. (2003). Preservice science teachers’ use of educational technology during student teaching. Retrieved from ProQuest Digital Dissertations. (AAT 3097272)
Johnson, C. (2006). Effective professional development and change in practice: Barriers science teachers encounter and implications for reform. School Science and Mathematics, 106(3), 15-161.
Kim, M. C., Hannafin, M. J., & Bryan, L. A. (2007). Technology-enhanced inquiry tools in science education: An emerging pedagogical framework for classroom practice. Science Education, 91(6), 1010-1030.
Loucks-Horsley, S., Hewson, P., Love, N., & Stiles, K. (1998) Designing professional development for teachers of mathematics and science. Thousand Oaks, CA: Corwin Press.
McNall, R. (2004). Beginning secondary science teachers’ instructional use of educational technology during the induction year. Dissertation Abstracts International, 64(10), 3636A. (UMI No. 3108794)
Miles, M.B., & Huberman, A.M. (1994). Qualitative data analysis: An expanded sourcebook (2nd ed.). Thousand Oaks: Sage.
Mishra, P., & Koehler, M.J. (2006). Technological pedagogical content knowledge: A framework for teacher knowledge. Teachers College Record, 108, 1017–1054.
Mullholand, J., & Wallace, J. (2005). Growing the tree of teacher knowledge: Ten years of learning to teach elementary science. Journal of Research in Science Teaching, 42, 767-790.
National Research Council. (1996). National science education standards. Washington, DC: National Academies Press.
Norris, C., Soloway, E., & Sullivan, T. (2002). Log on education: Examining 25 years of technology in U.S. Education. Communications of the ACM, 45(8), 15-18.
Pflaum, W.D. (2004). The technology fix: The promise and reality of computers in our schools. Alexandria, VA: Association for Supervision and Curriculum Development.
Ritt, H.A., & Bell, R.L. (2009, January). Components and impact of a science-specific introduction to educational technology course. A paper presented at the annual meeting of the Association for Science Teacher Education, Hartford, CT.
Sandholtz, J., Ringstaff, C., & Dwyer, D. (1997). Teaching with technology: Creating student-centered classrooms. New York: Teachers College Press.
Shulman, L. S. (1986). Those who understand: Knowledge growth in teaching. Educational Researcher, 15(2), 4–14.
Shamburg, C. (2004). Conditions that inhibit the integration of technology for urban early childhood teachers. Information Technology in Childhood Education Annual, 2004(1), 227-244.
Smetana, L.S., & Bell, R.L. (2009, April). Incorporation of computer simulations in whole-class vs. small-group settings. A paper presented at the annual meeting of the National Association for Research in Science Teaching, Garden Grove, CA.
Winn, W., Stahr, F., Sarason, C., Fruland, R., Oppenheimer, P., & Lee, Y.-L. (2005). Learning oceanography from a computer simulation compared with direct experience at sea. Journal of Research in Science Teaching, 43(1), 25-42.
Author Note:
Christine Schnittka
University of Kentucky
email: [email protected]
Randy L. Bell
University of Virginia
email: [email protected]
The Biology Project – http://www.biology.arizona.edu/human_bio/activities/karyotyping/karyotyping2.html
BrainPOP – http://www.brainpop.com/
Cells Alive – http://www.cellsalive.com/
ExploreLearning – http://www.explorelearning.com
Enzyme simulation (National Grid for Learning Cymru Web site) – http://www.ngfl-cymru.org.uk/vtc/20050330/Biology/keystage4/enzymes/enzymesac/introduct/default.htm
Library of Congress Everyday Mysteries – http://www.loc.gov/rr/scitech/mysteries/cricket.html
Living Stones Nursery and Plants for the Southwest – http://www.lithops.net/lithop7.htm
Matching up Chromosomes in a Karyotype – http://learn.genetics.utah.edu/content/begin/traits/karyotype/index.html
SMART Boards – http://www.smarttech.com
Introduction: Our research is focused on how teacher preparation programs can assist teachers in implementing effective science instruction. As a participant in this university’s program, you have been part of classes that have included this focus. In this interview, I’ll be asking you questions about what you’ve learned here and how you think about and prepare for teaching students.
- What do you consider to be the most important components of an effective lesson in science?
- How do you decide what the structure of the lesson will be? In other words, what the students will do and what you will do?
- How do you decide what instructional approach(es) to use? (Inductive, deductive, demonstration, inquiry, etc) PROBE: What role (if any) do you think technology will play in your decision making process?
- How do you define technology, as used in science classrooms?
- When do you think it is appropriate to incorporate technology into the lesson? PROBE (if TA doesn’t answer the above question thoroughly): How do you decide what technology to incorporate into a lesson, if any?
- What do you see as the purpose of using technology in teaching science?
- Based on your experience at this university, what technologies (hardware, software and web-based resources) do you think you will use during your student teaching experience? PROBE: Why?
- Do you think having a computer projection system in your classroom will affect your science instruction? Is so, how?
- What are some specific ways that you expect to use the computer and projector?
- Do you think having the SMART Board in your classroom will impact your science instruction? If so, how?
- What are some specific ways that you plan to use the SMART Board? PROBE: For visualization? Lesson planning?
- How do you think your use of the SMART Board/projection device will impact student learning? What about student engagement?
- Do you anticipate any problems in using technology during your student teaching?
- How confident do you feel using technology in your student teaching?
Introduction: Our research is focused on how teacher preparation programs can assist teachers in implementing effective math and science instruction. As a participant in this university’s program, you have been part of classes that have included this focus. In this interview, I’ll be asking you questions about what you’ve learned here and how you think about and prepare for teaching students.
- What do you consider to be the most important components of an effective lesson in science?
- How do you decide what the structure of the lesson will be? In other words, what the students will do and what you will do?
- How do you decide what instructional approach(es) to use? (Inductive, deductive, demonstration, inquiry, etc) PROBE: What role (if any) did technology play in your decision making process?
- How do you define technology, as used in science classrooms?
- When do you think it is appropriate to incorporate technology into the lesson? PROBE (if TA doesn’t answer the above question thoroughly): How do you decide what technology to incorporate into a lesson, if any?
- What do you see as the purpose of using technology in teaching science?
- Describe your most successful technology lessons.
- Describe your least successful technology lessons.
- Based on your experience at this university, what technologies (hardware, software and web-based resources) do you think you will use in your classroom next year? PROBE: Why?
- What successes or frustrations did you experience in your technology use efforts during student teaching?
- How did your cooperating teacher affect your technology use during your student teaching experience?
- How did having a computer projection system in your classroom affect your science instruction (if at all)?
- What are some specific ways that you used the computer and projector? PROBE: Did you utilize the remote control when using the projector? If so, what impact did it have on your instruction?
- How did having the SMART Board in your classroom impact your science instruction (if at all)?
- What are some specific ways that you used the SMART Board? PROBE: For visualization?
- What are the most significant outcomes on student learning resulting from your use of the SMART Board/projection device? PROBE: any impact on student engagement?
- What were you able to with the technology that you would not have been able to do without the technology? PROBE: on specific content
- Can you recall an instance where you had planned to teach in a particular manner and you changed your approach because you had access to technology?
- How confident do you feel using technology in your teaching?
- What suggestions would you make to improve this university’s teacher preparation program in regard to using technology to teach science?
![]()