Technology in Mathematics Teacher Preparation
In its most recent document, the National Council of Teachers of Mathematics (NCTM, 2000) stated, “Technology is essential in teaching and learning mathematics; it influences what is taught and enhances students’ learning” (p. 24). Whether technology will enhance or hinder students’ learning depends on teachers’ decisions when using technology tools, decisions that are often based on knowledge gained during a teacher preparation program. Recommendations by the Association of Mathematics Teacher Educators (AMTE, 2006) state that teacher education programs should “provide opportunities [for teachers] to acquire the knowledge and experiences needed to incorporate technology in the context of teaching and learning mathematics” (p. 1). The types of knowledge and skills prospective teachers need to support students’ uses of technology are further delineated in the International Society for Technology in Education National Educational Technology Standards for Teachers, which was originally released in 2000 and updated in 2008. There are strong recommendations for using technology to teach students who are learning mathematics and to prepare teachers who will teach mathematics.
The purpose of this article is to share and discuss some examples from materials developed by the Preparing to Teach Mathematics with Technology (PTMT) project created to prepare teachers to use technology to teach mathematics in ways appropriate for students who live in a world that includes rapidly changing digital technology (see http://www.ncsu.edu/project/ptmt/mods.htm). The project has thus far developed materials focused only on the content areas of statistics and probability, and examples will focus on these contexts. We present our guiding framework and examples from the materials, as well as a discussion of field test results and implications.
Guiding Framework
Teacher education and research on teachers has been greatly influenced by Shulman’s (1986) idea of teachers’ pedagogical content knowledge (PCK). For example, Simon (1995) used PCK to describe important components of a mathematics teaching cycle that includes a teacher’s knowledge of mathematics, mathematical activities and representations, students’ learning of particular content and their hypotheses about students’ current knowledge, and their personal theories about mathematics, learning, and teaching. More recently, several authors have described technology, pedagogy, and content knowledge (TPACK) as a type of teachers’ knowledge needed for teachers to understand how to use technology effectively to teach specific subject matter (Koehler & Mishra, 2005; Mishra & Koehler, 2008; Niess, 2005, 2006; AACTE Committee on Innovation and Technology, 2008). Koehler and Mishra (2005; Mishra & Koehler, 2008) claimed that TPACK is the integration of teachers’ knowledge of content, pedagogy, and technology (Figure 1).
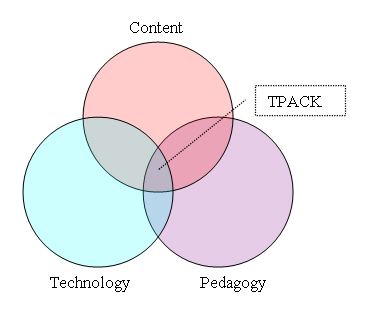 Figure 1. Components of technological pedagogical content knowledge.
With a focus on the intersection of the three components of technology, content, and pedagogy, Niess (2005) described four different aspects that comprise teachers’ TPACK:
- An overarching conception of what it means to teach a particular subject integrating technology in the learning process;
- Knowledge of instructional strategies and representations for teaching particular topics with technology;
- Knowledge of students’ understandings, thinking, and learning with technology; and
- Knowledge of curriculum and curriculum materials that integrate technology with learning.
These four aspects of TPACK essentially extend Simon’s (1995) components of teachers’ knowledge in a mathematics teaching cycle by incorporating a focus on technology.
Teacher preparation programs increasingly include a focus on the use of technology for teaching school mathematics (e.g., Powers & Blubaugh, 2005). In 2003, Kersaint , Horton, Stohl, and Garofalo reported that 21% of mathematics teacher educators who responded to their survey taught a course focused on technology. A few years later, Leatham (2006) reported that 29% of mathematics teacher educators had courses at their institutions focused on the teaching of mathematics with technology.
This attention to the need for a course on using technology in teaching mathematics is encouraging, but may not be prevalent enough in teacher education programs. Findings from a comprehensive national study suggest that teachers’ participation in stand-alone technology courses (often void of content) do not correlate highly with their abilities to integrate technology in teaching (Moursund & Bielefeldt, 1999). Evidence is building to suggest that a model integrating technology, pedagogy, and content is more effective for preparing teachers to use technology in their classrooms (AACTE Committee on Innovation and Technology, 2008; Niess, 2005; Suharwoto, 2006).
Given the changing nature of technology, it is important that teachers develop a model of teaching and learning that goes beyond the specifics of a technology tool so that they are able to make informed decisions about appropriate uses of technology in mathematics (Conference Board of Mathematical Sciences, 2001). Following from a model of the components of TPACK (Koehler & Mishra, 2005; Niess, 2005) and with support from recommendations for appropriate uses of technology in mathematics teacher education (AMTE, 2006; Garofalo, Drier, Harper, Timmenman, & Shockey, 2000; Suharwoto, 2006), such a model would integrate mathematics, technology, and pedagogy, with a focus on student thinking.
A key feature in our approach to preparing teachers to teach mathematics with technology is to integrally develop teachers’ TPACK. Teachers need to understand that critical instructional decisions they make are grounded in their understandings of each domain (technology, pedagogy, and content) and influenced by their beliefs and conceptions. We hypothesize that by integrally developing teachers’ understanding of mathematics, pedagogy, and technology with a focus on student thinking, we will help teachers develop a more complete picture of what is needed when teaching mathematics with technology and, in turn, be prepared to make informed decisions about appropriate uses of technology.
Benefits of Using Technology and an Integrated Approach
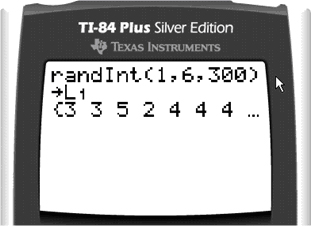 Building from the work of Pea (1987), Ben-Zvi (2000) provided a useful lens on technology use as waysto amplify or reorganize one’s statistical or mathematical work. According to Pea, technology tools are typically used in two different ways that are emphasized in our teacher education materials. Technology can amplify students’ abilities to solve problems or reorganize the way students think about problems and their solutions. The idea of an amplifier is that the tool expedites a process that could be completed without its use. For example, technology tools can be used to generate large lists of pseudorandom numbers quickly (see Video 1), and to generate graphical representations or compute least squares regression lines efficiently (Video 2).
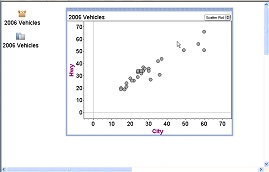 Technology tools can also be seen as a reorganizer. Through dynamic features of dragging, the linking of multiple representations, and overlaying measures on graphs, technology tools can be used in ways that extend what teachers may be able to do without technology to help students reorganize and change their statistical conceptions. For example, overlaying statistical measures such as a mean on a graphical representation (see Video 2) can help change the way teachers and students conceptualize these measures in relation to a bivariate distribution, particularly since the statistical measures update as data is changed by the user dragging points in the graph. This visualization is not possible without technology and can provide students with a way of reorganizing their conceptions of bivariate distributions.
These video examples are useful in illustrating the ways technology can be used to expedite mathematical process and have the potential to change the way students and teachers think about mathematical ideas. However, the technology itself will not change teachers’ understandings. Rather, the task posed, questions asked, and opportunities to reflect and discuss what technology is generating and how these results relate to mathematical ideas and pedagogical issues are what lead to better understandings.
To illustrate the integrated approach taken in our PTMT materials for developing prospective teachers’ TPACK, two excerpts are provided (see appendixes A and B). In Appendix A (pdf), a detailed description of how technology tools generate pseudorandom numbers is provided, and both mathematical and pedagogical issues related to conducting simulations with technology are addressed. In Appendix B (pdf), multiple representations are used to teach (or reinforce) prospective teachers’ understanding of least squares regression. Algebraic representations are purposely utilized in addition to the technologically generated representations to help promote a deeper understanding of regression. Both excerpts help illustrate an integrated approach for developing teachers’ knowledge of instructional strategies and representations for teaching important probability and data analysis topics—Niess’ (2005) second component of TPACK.
Another important component of TPACK is teachers’ knowledge of students’ learning with technology (Niess’ third component). Findings from research on students’ understandings of statistical ideas are used to make points, raise issues, and pose questions for teachers throughout the materials (e.g., see statements in blue type in appendixes A & B). After teachers have engaged in examining a statistical question with a technology tool, pedagogical questions aimed at developing their understanding of how technology and various representations can support students’ statistical thinking are often posed. Although prospective teachers may struggle in responding to these questions, the presence of such questions throughout the text create opportunities for pedagogical perturbations that can prompt reflection and critical thinking in their development of TPACK.
An effective strategy employed in the instructional unit suggested by research has students solving a mathematics problem and asking them to reflect upon their thinking and to consider their work from a student’s perspective (Simon & Tzur, 2004). However, prospective teachers often lack experience working with students using technology. Thus, they are unable to envision how a student may solve a mathematics problem with a tool in ways that may differ from their own solution path and to anticipate difficulties students may encounter. To provide opportunities for careful analysis of and reflection on students’ work with technology, a videocase is included in our PTMT materials.
The design of the videocase was informed by suggestions and implications from work by Lampert and Ball (1998), Towers (1998), and Bowers, Kenehan, Sale, and Doerr (2000). Towers (1998) and Lampert and Ball (1998) discussed the challenges prospective teachers have in shifting their attention outwardly on classroom events to examine closely students’ work and thinking. They are more accustomed to focusing inwardly on examining the practices of the teacher—the role for which they are preparing. They further suggested that, when using video and multimedia records of classroom practice, purposeful decisions need to be made to facilitate this shift in attention toward students. Thus, the video is focused on students rather than the teacher, students’ written work is provided, and questions focusing prospective teachers on the work of students are posed.
A decision was made when designing our videocase to show only the teacher when introducing the lesson and posing specific questions and, otherwise, to focus mainly on students’ work. Because the students in the video are working with a computer and the goal is to develop prospective teachers’ TPACK, we used a picture-in-picture format that merges the video of students’ work with TinkerPlots with the video of the two students’ interactions (Konold & Miller, 2004). Furthermore, the larger of the two frames is the video of the computer work. This format was intentional so that prospective teachers can focus on the particular actions of students within the software environment while solving the data analysis task.
In the design of their videocase materials, Lampert and Ball (1998) and Bowers et al. (2000) specifically included and advocated for having prospective teachers engage in the mathematical tasks used in the videos. Bowers et al. (2000) further recommended that prospective teachers engage in the mathematical task before viewing the video. In the videocase, prospective teachers use TinkerPlots to analyze the same data set and answer the exact questions that students were asked. The prospective teachers engage in this task before viewing the video, reflect on their own mathematical thinking and use of the software, then make predictions about how middle school students might approach the same task. This process of reflection and anticipation of students’ work can provide opportunities for surprise and possible perturbations when prospective teachers observe students doing work that is not as they expected.
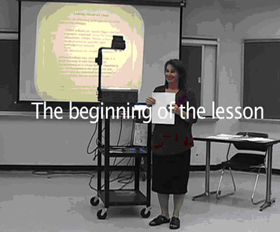 The entire video (18 minutes) is synchronized with the transcript. The beginning of the video shows how a teacher uses the following quote to pique students’ interest in the data set (Video 3) : “Public schools are usually bigger and less expensive (especially if you live in-state) than private schools. Private schools tend to be more selective and offer more individualized attention” (Source: http://apps.collegeboard.com/search/adv_typeofschool.jsp).
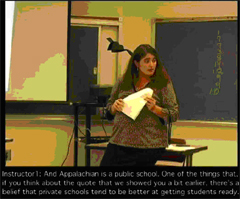 The video then transitions to the portion of the lesson where a teacher introduces the specific question of whether private schools have better graduation rates than public schools (Video 4). She refers back to the opening quote and focuses the students on the task. The remaining part of the video shows Kathy and Jordon working with TinkerPlots to analyze data, a portion of which is shown in Video 5. The videocase also includes scanned copies of the worksheets with students’ responses.
The videocase allows several issues to emerge for prospective teachers. When initially 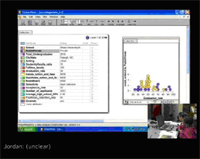 engaged in the mathematical task, many prospective teachers compare the public and private colleges with parallel box plots in which they overlay the means for each. Their judgments often consider both measures of center and spread. The students create a dot plot of the graduation rates and recolor the cases based on whether they are public or private. Thus, they use color as a tool to consider a second variable in the data set.
When they view and reflect on students’ work in the video, prospective teachers attend to how the students are often focused on individual data points and select cases in the plot and view the corresponding values for a third variable (student-to-faculty ratio) in the data cards. The videocase allows prospective teachers to realize that, although the students’ work does not look as formal as their own, the students are coordinating three variables in their response to a question about two variables.
The prospective teachers are also able to consider the focusing effects of the contexts and questions posed to students. The original quote used to launch the lesson explicitly refers to greater individualized attention at private colleges. These students seem to be attracted to the measure of student-to-faculty ratio as an indicator of individualized attention at a college. This was noted by the prospective teachers as they analyzed student work. In particular, in response to the task, “Describe how the students’ attention to the attribute “student to faculty ratio” affected their analysis,” one of the prospective teachers in the class (George) responded, as follows:
The students were perplexed by the fact that colleges with a high student-to-faculty ratio could have a higher graduation rate than colleges with lower ratios. They incorrectly assumed that a lower student to faculty ratio automatically meant that the school would have a higher graduation rate.
George had observed the students clicking on individual data icons in the distribution and trying to make sense of a few data points in the middle of the distribution that did not follow the initial trend they had found. Thus, he was making an inference about what they may have been thinking based on the work he observed them do with the technology.
Another student, Jay, critiqued the task by saying, “I would say it was an appropriate question, relatively easy to answer but the only limitation is that they do not have much knowledge of college.” Jay evaluated the task based on a coordination of his work, his thinking, and his observations of the students’ work and inferring that the students might not have a complete understanding of some of the variables in the data set. The videocase played a critical role in our design of the entire module to develop prospective teachers’ TPACK. While analyzing students’ work, the prospective teachers engaged in reasoning that is at the intersection of technology, pedagogy, and content.
Evaluation and Implications
A scientific approach to the development of the module (Battista & Clements, 2000) was implemented through the use of a cyclical process that involved (a) explicating the vision, philosophy, and goals for the instructional materials, (b) creating instruments to assess whether the instructional goals were met,(c) collecting control group data, (d) developing lessons, (e) collecting data while testing the materials with students, and (f) revising the materials based on analyses of the data.
Because the purpose of the material was to develop teachers’ TPACK, a pre-post instrument was developed to assess teachers’ understandings related to each of these domains. Questions on the content section were selected from Garfield (2003) and others from the ARTIST database (https://app.gen.umn.edu/artist). Due to the small sample sizes, a Wilcoxon Signed Rank Sum test was used to compare the differences in gains from the pre- to posttest with an alpha level of 0.10.
The materials have been through four iterations of classroom field-testing with preservice teachers, analysis of field-testing data, and subsequent revisions. The module has been implemented in a 400-level course, Teaching Mathematics with Technology, at our university. This course serves middle and secondary prospective teachers and a few beginning graduate students with little experience using technology. Typical class sizes have been 13-20. During the 5-week unit on data analysis and probability, the instructor in fall 2005 (not one of the authors) used the pre-existing established curriculum for the course to serve as a control group. In each of the subsequent semesters (spring 2006, fall 2006, spring 2007, fall 2007), the course was taught by the same instructor as fall 2005, and the new materials were used for the 5-week unit on data analysis and probability. In addition, in spring 2007, the module was implemented in a section of the course taught by a different instructor. In the first three implementation semesters, written work was collected from students and pre- and posttests were given. During the first two implementation semesters in 2006, the class sessions were videotaped and several students were interviewed.
Analysis of data from the first pilot test of the materials (Experimental I) indicated that, although teachers’ improved in their understanding of statistical and probabilistic concepts and their uses of technological tools, their pedagogical understandings did not. The gains in Experimental I (n = 18) were significantly higher (p = .10) than the control group (n = 15), specifically with items related to content knowledge (p = .007) and technology (p = 0.058). A review of the instructional materials indicated that an emphasis on pedagogy was not strongly represented, so the materials underwent a revision to more strongly emphasize pedagogy.
The revised materials included many more opportunities for teachers to consider and discuss pedagogical issues. Such opportunities included more description in the main text regarding pedagogy, including students’ typical difficulties with concepts or technology tools. Other opportunities included more focused pedagogy questions that required teachers to consider carefully the pedagogical choices they would make when using a technology tool with students in a particular lesson. For example, see the text highlighted in blue in appendixes A (section 2) and B (section 5).
The following semester when the revised materials were tested, gains in students’ pedagogical knowledge were evident. For example, consider the three pedagogical questions in Appendix C. A snapshot of scores on a few test items (Table 1) illustrates the increased gains in pedagogical content knowledge and TPACK. The teachers in the fall 2006 (Experimental II) were more able to choose an appropriate dataset for creating a lesson exploring mean and median (Question 20) and could justify their choice with a more sophisticated rationale that included attention to the distribution’s shape, including effects of outliers, skewness, or repeated measures (Question 21). In addition, they were slightly more able to make appropriate interpretations of students’ understanding of correlation based on students’ work on a graphing calculator and their statements (Question 22).
Table 1
Scores on Select Pedagogy Questions Across Semesters
|
| Fall 2005 | Spring 2006 | Fall 2006 | |||
Q# |
| Pre | Post | Pre | Post | Pre | Post |
20 | % correct | 33% | 39% | 44% | 33% | 50% | 67% |
21 | Mean score | 0.78 | 1.29 | 0.72 | 1.78 | 1.13 | 2.33 |
22 | % correct | 56% | 61% | 56% | 61% | 50% | 73% |
We note, though, the difficulties in developing measures of teachers’ TPACK that go beyond assessing independently a teacher’s understanding of technology, pedagogy, and content. The questions we created assessed prospective teachers’ knowledge of statistics and probability concepts (CK), use of technology for particular mathematical tasks (TC), and pedagogical decisions prospective teachers might make when teaching probability and statistical concepts with and without technology (PCK, TPCK). These assessments, particular the latter type, were lengthy and designed for paper and pencil, so they did not provide an in-depth view of the understandings teachers developed or were developing. Thus, the comparisons that could be made between control and experimental groups were limited by the measures used.
Details on quantitative and qualitative analysis of the effectiveness of these materials have been reported elsewhere. Hollebrands, Wilson and Lee (2007, 2008) have done extensive analysis of prospective teachers’ work on the videocase and the ways in which prospective teachers interpret students’ work with technology and begin to reflect on the ways students’ thinking may influence their work with a task or technology tool. The findings indicate that the videocase materials provide opportunities for, and we have seen evidence of, prospective teachers building models of students’ thinking in a way that promotes restructuring of their TPACK. Lee, Hollebrands, and Wilson (2007) have reported on the successes and difficulties prospective teachers have in transferring their work on repeated sampling with probability simulations in the module to creating a probability simulation task for students. Although the prospective teachers typically create appropriate probability simulations with technology tools, they do not consistently suggest in their lessons that students should engage in repeated sampling, use large sample sizes, or use a variety of representations to analyze the data.
Lee and Lee (2008) have done a quantitative and qualitative analysis of the ways in which the module successfully engages prospective teachers in coordinating center and spread in probability and statistics contexts. Their analysis identified strengths in the text of the module and missed opportunities in the text for focusing prospective teachers on this important concept in data analysis. The results have informed revisions of the module and particular issues to raise in faculty professional development for learning to implement the module.
Conclusion
With technology becoming a ubiquitous part of daily experiences, it is important for mathematics teachers, many of whom are “digital immigrants,” to build on the experiences of “digitally native” students (Prensky, 2002, p. 1). To do so, teachers need to know how to capitalize on the power of technology to create lessons that assist students in developing understandings of mathematics. An instructional model that engages prospective teachers in solving mathematics tasks using technology tools and encourages them to reflect on those experiences from the perspective of a teacher provides an integral learning experience that is similar to what they will encounter when placed in a classroom. By developing prospective teachers’ mathematics TPACK, they are not only prepared for the classrooms of today but they will have the knowledge and skills to navigate within the classrooms of tomorrow. However, there is a clear need for longitudinal studies to observe effects of a focus on TPACK in teacher education materials on teachers’ practices with their students.
References
AACTE Committee on Innovation and Technology. (2008). Handbook of technological pedagogical content knowledge (TPCK) for educators. New York: Routledge.
Association of Mathematics Teacher Educators. (2006). Preparing teachers to use technology to enhance the learning of mathematics: A position of the Association of Mathematics Teacher Educators. Retrieved from http://www.amte.net/Approved%20AMTE%20Technology%20Position%20Paper.pdf
Battista, M., & Clements, D. (2000) Mathematics curriculum development as a scientific endeavor. In A. Kelly & R. Lesh (Eds.), Handbook of research design in mathematics and science education (pp. 737-760). Mahwah, NJ: Lawrence Erlbaum Associates, Publishers.
Ben-Zvi, D. (2000). Toward understanding the role of technological tools in statistical learning. Mathematical Thinking and Learning 2(1 & 2), 127-155.
Bowers, J., Kenehan, G., Sale, J., & Doerr, H. M. (2000, February). Designing multimedia case studies for preservice teachers: Pedagogical questions and technological design solutions. In Proceedings of the Society for Information Technology & Teacher Education, San Diego, CA. (ERIC Document Reproduction Service No. ED 444-556)
Conference Board of the Mathematical Sciences. (2001). The mathematical education of teachers. Providence, RI: American Mathematical Society.
Garfield, J. B. (2003). Assessing statistical reasoning. Statistics Education Research Journal 2(1), 22–38. Retrieved from http://www.stat.auckland.ac.nz/~iase /serj/SERJ2(1).pdf
Garofalo, J., Drier, H. S., Harper, S., Timmerman, M.A., & Shockey, T. (2000). Promoting appropriate uses of technology in mathematics teacher preparation. Contemporary Issues in Technology and Teacher Education, [Online serial] 1(1), Retrieved from https://citejournal.org/vol1/iss1/currentissues/mathematics/article1.htm
Hollebrands, K. F., Wilson, P. H., & Lee, H. S. (2007, October). Prospective teachers use of a videocase to examine students’ work when solving mathematical tasks using technology. Proceedings of the twenty-ninth annual meeting of the Psychology of Mathematics Education-North American Chapter, Lake Tahoe, UT. Retrieved from http://www.allacademic.com//meta/p_mla_apa_research_citation/1/8/8/5/6/pages188561/p188561-1.php
Hollebrands, K. F., Wilson, P. H., & Lee, H. S. (2008). Understanding prospective mathematics teachers’ processes for making sense of students’ work with technology. Manuscript submitted for publication.
International Society for Technology in Education. (2008). National educational technology standards for teachers. Retrieved from http://www.iste.org/Content/NavigationMenu /NETS/ForTeachers/NETS_for_Teachers.htm
Kersaint, G., Horton, B., Stohl, H., & Garofalo, J. (2003). Technology beliefs and practices of mathematics education faculty. Journal of Technology and Teacher Education, 11(4), 567-595.
Koehler, M.J., & Mishra, P. (2005). What happens when teachers design educational technology? The development of technological pedagogical content knowledge. Journal of Educational Computing Research, 32(2), 131-152.
Konold, C., & Miller, C. (2004). TinkerPlots™ Dynamic Data Exploration (Version 1.0).
Emeryville, CA: Key Curriculum Press.
Lampert, M., & Ball, D. L. (1998). Teaching, mathematics, and multimedia: Investigations of real practice. New York: Teacher’s College Press.
Leatham, K. (2006, January). Characterizing the preparation of preservice secondary mathematics teachers to teach mathematics with technology. Paper presented at The Association of Mathematics Teacher Educators, Tampa, FL. Slides retrieved from http://www.mathed.byu.edu/%7Ekleatham/ResearchProjects/AMTEpresentation2006.htm
Lee, H. S., Hollebrands, K. F., & Wilson, P. H. (2007). Preservice mathematics teachers’ design and use of probability simulations. Slides available at http://www.ncsu.edu/project/ptmt/PTMT_NCTM2007Symposium.pdf URL DOESN’T WORK
Lee, H. S., & Lee, J. T. (2008, February & March). The use of intervals to help coordinate understandings of center and spread: A preliminary report. In the Proceedings of the Conference on Research in Undergraduate Mathematics Education conference, San Diego, CA. Retrieved from http://cresmet.asu.edu/crume2008/Proceedings/Lee&Lee%20LONG.pdf
Mishra, P., & Koehler, M. (2008, March). Introducing technological pedagogical content knowledge. Paper presented at the annual meeting of the American Educational Research Association, New York.
Moursund, D., & Bielefeldt, T. (1999). Will new teachers be prepared to teach in a digital age? A national survey of information technology in teacher education. Santa Monica, CA: Milken Exchange on Education Technology and the International Society for Technology in Education.
National Council of Teachers of Mathematics. (2000). Principles and standards for school mathematics. Reston, VA: Author.
Niess, M.L. (2005). Preparing teachers to teach science and mathematics with technology: Developing a technology pedagogical content knowledge. Teaching and Teacher Education, 21, 509-523.
Niess, M. L. (2006). Guest editorial: Preparing teachers to teach mathematics with technology. Contemporary Issues in Technology and Teacher Education [Online serial], 6(2). Retrieved from https://citejournal.org/vol6/iss2/mathematics/article1.cfm
Pea, R. D. (1987). Cognitive technologies for mathematics education. In A. Schoenfeld (Ed.), Cognitive science and mathematics education (pp. 89-122). Hillsdale, NJ: Erlbaum.
Powers, R., & Blubaugh, W. (2005). Technology in mathematics education: Preparing teachers for the future. Contemporary Issues in Technology and Teacher Education [Online serial], 5(3). Retrieved from https://citejournal.org/vol5/iss3/mathematics/article1.cfm
Prensky, M. (2002, September/October). Digital natives, digital immigrants, Part I. On the Horizon, 9(5) 1, 3-6.
Shulman, L. (1986). Those who understand: Knowledge growth in teaching. Educational Researcher, 15(2), 4-14.
Simon, M. A. (1995). Reconstructing mathematics pedagogy from a constructivist perspective. Journal for Research in Mathematics Education, 26(2), 114-145.
Simon, M. A., & Tzur, R. (2004). Explicating the role of mathematical tasks in conceptual learning: An elaboration of the hypothetical learning trajectory. Mathematical Thinking and Learning 6(2), 91-104.
Suharwoto, G. (2006). Secondary mathematics preservice teachers’ development of technology pedagogical content knowledge in subject-specific, technology-integrated teacher preparation program. Unpublished doctoral dissertation, Oregon State University.
Towers, J. (1998). Close encounters of the complex kind: Using videotapes in teacher education. Paper presented at the annual meeting of the American Educational Research Association, San Diego, CA. (ERIC Document Reproduction Service No. ED 420 625).
Author Note
The Preparing to Teach Mathematics With Technology project is supported by the National Science Foundation under Grant No. DUE 04-42319 awarded to North Carolina State University. Any opinions, findings, and conclusions or recommendations expressed herein are those of the authors and do not necessarily reflect the views of the National Science Foundation. More information about the project and materials can be found at http://www.ncsu.edu/project/ptmt.
Hollylynne Lee
North Carolina State University
[email protected]
Karen Hollebrands
North Carolina State University
[email protected]
Appendix A
Simulating Randomness in Technology Tools
Appendix B – The Least Squares Regression Line
Appendix C
Sample Test Items and Correct Responses
20) You are planning a lesson to help students decide when a mean or a median is a more appropriate measure of central tendency. Which of the following data sets would be the most appropriate for you to use? [two correct choices are accepted, a or b]
a. 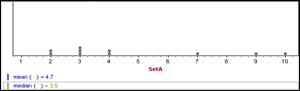
b. 
c. 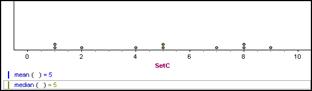
d. 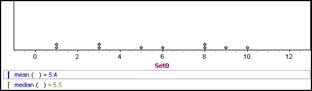
21) Explain your choice for Question #20.
Scoring Rubric
| 3 | They select choice a and their explanation highlights the importance of outliers or the skewness of the data and connects these factors (outliers, skewness) to its effects on the mean and median. OR They select choice b and their explanation highlights the importance of a repeated measure (at 4 and 10) and its effect on the mean and median. |
| 2 | They select choice a or b and they have an incomplete explanation that discusses the shape or the centers but does not connect the two (shape and centers). Their explanation also highlights the differences between mean and median |
| 1 | Only addresses the fact that the mean and median are different in choices a and b. Does not attend to the distributions or the effects of that distribution on those measures. |
| 0 | Incomplete, insufficient, incorrect (e.g., chooses c or d and justifies data set use because the mean and median are similar) |
22).
The following task was given to students:
Is there a linear relationship between the following variables? Explain your reasoning.
| x | y |
73 | 68 |
77 | 79 |
84 | 74 |
82 | 76 |
81 | 72 |
79 | 77 |
76 | 74 |
78 | 69 |
125 | 117 |
80 | 79 |
In response to this task, a group of students enter the data in L1 and L2 on their graphing calculator and do a linear regression with the following output:
When groups are sharing their work to this task, this group shows the result above and claims that “since the correlation coefficient (r) has a value close to 1, the data is linear and you can use the equation y = .91x + 2.88 to find y given any x.
What statement best captures the most likely interpretation of the students’ understanding of correlation as an indicator of a linear relationship?
- The equation produced from the linear regression should be interpreted independently from the value of the correlation coefficient.
- A linear relationship can be inferred from correlation values above 0.8.
- A correlation coefficient close to 1 (r = 0.96) allows one to use a linear regression equation as a function rule to generate any y value for a given x.
- A correlation coefficient close to 1 (r = 0.96) suggests that there may be a strong positive linear relationship between the two variables, but that one must consider other indicators such as the scatterplot and residuals.
![]()