Data-driven decision making (DDDM) continues to gain appeal in education. As a matter of policy, accountability requirements set forth at various levels, such as those in the No Child Left Behind (NCLB) legislation, have put pressure on school systems to gather and use data to inform and initiate changes in teaching practice. Although it can be operationalized in myriad ways, DDDM can be described as the use of student-level information to guide a range of decisions related to the operation of the school.
Wayman (2005) pointed out that “schools have been ‘data rich’ for years but ‘information poor’ because the vast amounts of available data they had were often stored in ways that were inaccessible to most practitioners” (p. 296). Moreover, the data used in DDDM usually come from standardized tests, and classroom level assessments such as course grades are largely absent from the discussion (Bowers, 2009). Bowers’ research made the case for paying more attention to course-level grades assigned by teachers as a valid and valuable source for DDDM. Given that these grades are based on a collection of evidence, educators and administrators can drill down further and look at the discrete elements that comprise them.
DDDM conducted with classroom-level assessments can be a powerful tool for formative assessment both for the purposes of instruction and curricular refinement. Erikson (2007) described the effective use of formative assessment that “requires that the teacher develop systematic ways of paying close attention to the particular understandings of particular students (p. 192).” According to Bloom, Hastings, and Madeus (1971), formative assessment is part of the process of mastery learning. The formative assessment process consists of mapping out unit objectives via a table of specifications, administering an assessment, analyzing the item performance, analyzing individual performance, and taking corrective action.
Formative assessment can be thought of as instructional DDDM that leads to organizational learning, which can be defined as the “detection and correction of error” (Argyris & Schon, 1978, p. 2). Accordingly, DDDM of classroom assessments has potential to benefit both individual teachers and entire school divisions. The practice of formative assessment has been around for a long time, but it has yet to be implemented with fidelity at scale. Micheal Scriven (1967) first coined the term when describing approaches to program evaluation. Benjamin Bloom (1968) adopted the term for the purpose of describing instruction. In both examples the assessment process was to drive action.
Instructionally, formative assessment can mean many things. Bloom described it as a formal and intentional process, but people commonly refer to it as just-in-time interactions with students. The frequency of formative assessments is another aspect that varies between instructional and administrative contexts. Wiliam (2006) provided several examples of the many ways formative assessment has been operationalized, from a science supervisor reviewing state tests to plan professional development needs (programmatic extended-cycle formative assessment) to a language arts teacher having her students hold up cards indicating their answer to a question (instructional short-cycle formative assessment).
Based on their extensive review of the research on formative assessment, Black and Wiliam (1998) summarized some of the problems inherent with its adoption and implementation:
Teachers will not take up ideas that sound attractive, no matter how extensive the research base, if the ideas are presented as general principles that leave the task of translating them into everyday practice entirely up to the teachers. Their classroom lives are too busy and too fragile for all but an outstanding few to undertake such work. What teachers need is a variety of living examples of implementation, as practiced by teachers with whom they can identify and from whom they can derive the confidence that they can do better. They need to see examples of what doing better means in practice. (p. 146)
Stiggins (2004) argued that to make formative assessment a powerful tool teachers must be provided with “the tools they need to build classroom environments that promote learning through continuous student-involved assessment, record keeping and communication” (p. 26).
In the sections that follow, a focus-group study conducted with preservice teachers is presented to explore potential barriers for the successful adoption of the CaseMate system, a tool created to support DDDM.
CaseMate: An Open Source Tool to Support Formative Assessment
The CaseMate tool was initially developed to meet the needs of faculty members who wanted to create web-based instructional cases but had neither the skill nor inclination to learn the web-design techniques needed. Over time, the tool has been refined and redefined as a way to provide a scaffolded environment to deploy web-enhanced formative assessment.
The environment allows instructors to arrange various media elements with embedded assessments that display and deliver students’ assessments to the teacher. While this type of feedback on performance can be accomplished in a variety of platforms, the CaseMate project has focused on the ways in which the results are presented to instructors. As previously noted, the form in which formative assessment is delivered is key. An assumption underlying the CaseMate project has been that using the results from an assessment in a formative manner requires an instructor to make sense of the data collected. If this process can be streamlined and made easier, the likelihood of formative assessment being employed will be increased.
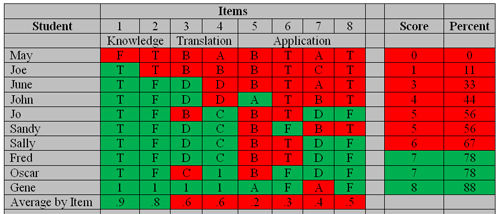
A person-by-item matrix is one way to organize results from an assessment (see Table 1). The person-by-item technique has been used in the educational measurement community for decades (e.g., see Harnisch & Linn, 1981). Looking at aggregate scores is too general a method of interpreting assessment results, and a closer look at the patterns embedded in the responses can “yield important information about student preparation” (p. 5).
Table 1
Person-by-Item Matrix for Analyzing Results of an Assessment
Student | Items | Score | Percent | |||||||
1 | 2 | 3 | 4 | 5 | 6 | 7 | 8 | |||
Knowledge | Translation | Application | ||||||||
| May | 0 | 0 | 0 | 0 | 0 | 0 | 0 | 0 | 0 | 0 |
| Joe | 1 | 0 | 0 | 0 | 0 | 0 | 0 | 0 | 1 | 11 |
| June | 1 | 1 | 1 | 0 | 0 | 0 | 0 | 0 | 3 | 33 |
| John | 1 | 1 | 1 | 0 | 1 | 0 | 0 | 0 | 4 | 44 |
| Jo | 1 | 1 | 0 | 1 | 0 | 0 | 1 | 1 | 5 | 56 |
| Sandy | 1 | 1 | 1 | 1 | 0 | 1 | 0 | 0 | 5 | 56 |
| Sally | 1 | 1 | 1 | 1 | 0 | 0 | 1 | 1 | 6 | 67 |
| Fred | 1 | 1 | 1 | 1 | 0 | 0 | 1 | 1 | 7 | 78 |
| Oscar | 1 | 1 | 0 | 1 | 0 | 1 | 1 | 1 | 7 | 78 |
| Gene | 1 | 1 | 1 | 1 | 1 | 1 | 0 | 1 | 8 | 88 |
| Average by Item | .9 | .8 | .6 | .6 | .2 | .3 | .4 | .5 | ||
The version presented here is based on Edward Kifer’s (1997) use of this technique. Kifer, professor emeritus at the University of Kentucky, studied with Benjamin Bloom and has been involved in leading assessment efforts for over 30 years. In the matrix, the items (questions) are arranged across the top according to cognitive complexity, while the students are ordered by ascending overall performance. This arrangement provides an efficient way to determine where the gaps in student learning are and what types of interventions are most prudent.
An instructor teaching this course might react to the data in Table 1 with the following interventions. Items 5 and 6 are topics that clearly need to be revisited by the instructor. Only 2 of the 10 students successfully answered Item 5, and only 3 of the 10 students correctly answered Item 6. Items 1 and 2 appear to be well learned, as illustrated by high degree of success on those items. The students who missed those items also performed poorly on the majority of the assessment and need more intensive interventions, such as tutoring or regular attendance at office hours. Items 3, 4, and 8 could be remediated by using peer-tutoring techniques such as think-pair-share, so that half the students could clear up the misconceptions of their peers (Larsy, Mazur, & Watkins, 2008).
By adding conditional formatting to color code the person-by-item results matrix, the internal patterns of the data immediately become more recognizable, as shown in Table 2. Additionally, the actual responses can be entered for each student so that another layer of data can be integrated, furthering the inferences that can be made by the instructor. For example, did the students who missed the item choose the same incorrect answer (Item 5) or were the incorrect choices evenly distributed among the distractors (e.g., Item 7)? Ikemoto and Marsh (2007) described the presence of computer interfaces as a factor that can facilitate DDDM in K-12 settings and found that “even when examining simple data, educators valued data dashboards that summarized data and data software systems that allowed them to manipulate and display raw data” (p. 124).
Table 2
Color Coded Person-by-Item Matrix for Analyzing Results of an Assessment
In reviewing the course management software and grade books, the displays of data were driven by an approach that emphasized the ultimate calculation of the final (summative) semester grade. One could generate a person-by-item matrix from an assessment delivered via an online course management system, such as Blackboard, which is in use at many universities, or Moodle, which is in use in many high schools. However, DDDM using course-management-system-based assessments requires exporting the data to another program such as Excel and using techniques such as pivot tables, formulas, and conditional formatting.
The color-coded person-by-item matrix display is a key feature of CaseMate, with the intention of allowing an instructor to visually analyze the results of an assessment quickly. Figure 1 shows an example of the interface where students view materials and respond to questions. Figure 2 shows an example of the instructor feedback screen that was generated. The design intention of the software was to be a catalyst for engaging teachers in practice of DDDM at the classroom level.
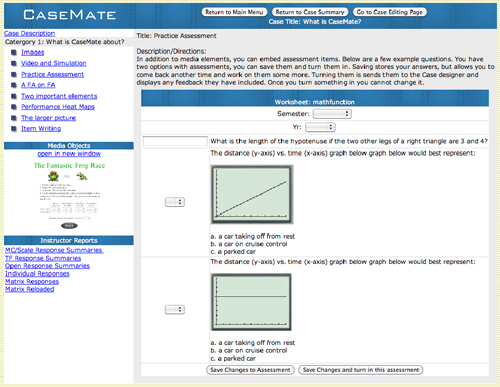
Figure 1. Screen capture of the software interface where students would view questions and enter their responses.
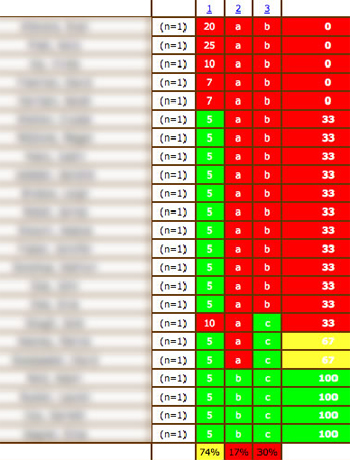 Figure 2. Results from the questions shown in Figure 1 compiled in a color-coded person by item matrix.
In the following sections a focus-group study is presented. It was conducted with preservice teachers to explore potential barriers for the successful adoption of the CaseMate system. Referring to the problems encountered during programmed instruction initiatives, Morgan (1978) stated, “When researchers started working in real schools they discovered a whole new world of problems that constrained the improvement of the educational process. These problems were political, economic, and procedural” (p. 151).
If the functionality is not compelling or does not dovetail with the contextual environments of the schools in which teachers work, the chance of any type of widescale use is slim. Thus, the research questions for this study, focusing on exploring CaseMate as an example of a web-based tool for DDDM, are as follows:
- How can CaseMate play a role in facilitating formative assessment in the classroom.
- W hat are the professional development and curricular policies that are needed to support the use of CaseMate (or other web-based tools)?
Methods
Patton (2002) described utilization-focused evaluations as studies that focus on “intended use by intended users” (p. 172). To accomplish such evaluation effectively the researcher must interact with the intended consumers of the research. The assumptions that undergird the design of a product or tool may be at odds with the existing practices.
Although various pilots and beta testing for CaseMate have documented the technical robustness from a deployment standpoint, we needed to look at what steps should be taken to make the transition to the K-12 setting. Because a target audience for the CaseMate environment is preservice teachers, a usability study was conducted with 46 preservice students in a masters program for teaching. The group included secondary mathematics, science, English and social studies preservice teachers who had completed at least 12 weeks of student teaching at the time of the intervention. The usability study was broken into four parts: (a) a presession survey and reading, (b) a group session involving a demonstration of using data to facilitate instruction, (c) an analytic task event, and (d) a postsession survey. Table 3 summarizes the timeline of the usability study. Analytic induction was used to explore response patterns and issues within the data set (Worthen, Sanders, & Fitzpatrick, 1997).
Table 3
Design for Usability Testing With Preservice Teachers
Group | O1 | Demonstration of system using presession survey data | Data Set 1 and DAT | Data Set 2 and DAT | O2 |
A | O1 | Color-Coded | Non Color-Coded | O2 | |
B | O1 | Non Color-Coded | Color-Coded | O2 | |
| Notes. O1 – presession survey on formative assessment taken via the online tool; O2 – postsession survey provided via hardcopy; DAT – Data analysis task worksheet. | |||||
Procedures
Stage 1: Presession Survey and Reading. The participants were given an article that outlined how corrective and enrichment activities are an essential component of formative assessment. A questionnaire consisting of 10 forced-response items and three open-response items related to the concepts of formative assessment and their experiences and perceptions of the barriers associated with its implementation was given to the participants. Participants completed the questionnaire in the CaseMate environment to expose them to the student side of the experience.
Stage 2: In-session Demonstration. At the group session, the results from the questionnaire were used with a corrective framework (Crouch & Mazur, 2001) as an example of formative use of assessments. Correctives such as reteaching and small group or individual tutorial experiences were linked to performance outcomes on formative assessments.
Stage 3: In-session Analytic Task. The analytic task involved giving the participants two sets of data, one color coded and one not color coded. For each data set they were asked the following questions:
“Pretend this data set came from one of your classes. Overall, was your teaching effective? Give data that supports your response”
“Based on the assumption that the assessment increases with cognitive complexity, what correctives would you use?”
At first, half the participants got the color-coded matrix (Figure 3 and Figure 4), while the other half got the plain matrix with non-colored-coded numeric data (Figure 5 and Figure 6). The participants were given 5 minutes to examine their respective data set. A second data set was handed out, and this time the participants were given the alternate formatted matrices. Another 5-minute period was given to the participants to examine the data sets.
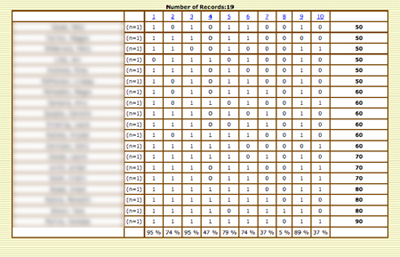 Figure 3. Plain formatted person-by-item matrices for data set 1.
Figure 4. Color-coded person-by-item matrices for data set 1.
Figure 5. Plain formatted person-by-item matrices for data set 2.
Figure 6. Color-coded person-by-item matrices for data set 2.
Stage 4: Postsession Survey. Following a discussion of the analytic task, the participants were given a form that asked them to rate the usefulness of the addition of color to the person-by-item matrices as (a) “It interfered with my instructional decision making,” (b) “It had a minor positive influence,” or (c) “It is a highly desirable feature.” The participants were asked to provide a rationale for their selections.
Analysis
Inductive reasoning begins with observations, which are then used to determine patterns that form a tentative hypothesis and eventually lead to the formation of theory. Worthen et al. (1997) outlined the steps involved in analytic induction to include
- Focusing and concentrating, using working hypotheses as focal points for further observation and documentation. As these working hypotheses are tested, those that are supported receive further attention, whereas those that are not supported are noted, along with the evidence used to reject them.
- Verifying working hypotheses using confirmation checks and triangulation to increase the certainty that these conclusions are accurate.
- Assimilating conclusions so that they are placed in the broader context of what else is known about the object of the evaluation. (p. 390)
We began with multiple readings of the entire set of data resources. Instances of phenomena that were of interest were highlighted during the early revisions. From these initial readings and the impressions formed during the data collection processes, we formed initial assertion topics. Choosing assertion topics rather than specific hypotheses ensured that conflicting and tangential data were captured and used in the forming and reshaping of the assertions. The subsequent readings were used to identify information from the data corpus that either confirmed or refuted the initial assertions. Once this stage was completed, the data elements associated with each assertion were used to rewrite or discard the assertions.
Results
The data collected to respond to these questions were gathered and analyzed using an inductive approach. Three assertions emerged from the analysis:
- Curriculum structure and policy can inhibit the implementation of formative assessment.
- Data access to student assessments is supported by color-coded dashboard displays.
- Data interpretation varies widely: A hodgepodge of heuristics exists.
The following sections detail each of these findings.
Curriculum Structure and Policy Can Inhibit the Implementation of Formative Assessment
This finding relates to the implications of policy-driven pacing pressure on the use of formative assessment for instructional effectiveness. In the pre-use survey, the participants were asked how they were currently employing formative assessment and what they found to be the biggest challenge in their student teaching placements.
Three items emerged as barriers: (a) time, (b) uncertainty of how to address learning gaps exposed by a formative assessment, and (c) student motivation. The barrier of time is partially related to the way formative assessment has been defined in the school setting. The definition of formative assessment appears to be one of just-in-time feedback and checks for understanding.
The district where most of the participants were placed for student teaching stressed the use of exit slips and common pacing of units. The participants often cited the use of bell ringers and exit slips as examples of how they use formative assessment. (Each of the following statements from the presession survey is from a different participant.)
Time – it is challenging to take the time during class to do formative assessment, then to take the time to analyze the information, and finally to take more class time the following day to implement corrective activities. Typically the biggest barrier is slowing down the pace of the class to review information covered the previous day for more than a few minutes.
Time! Especially now that we are trying to keep up with a common departmental “calendar” in terms of completing a unit by a certain date, time seems to be my enemy. I think that is the biggest drawback to a common planning theme whereby everyone is supposed to adhere to a specific timeframe.
Time seems to always be against me. There seems to be constant pressure to keep the class moving, to be conscious of the calendar, to cover as much curriculum as possible. Also, state and district assessment requirements can be rather stringent and seem to frequently leave students exhausted. Asking students to complete an assessment with any kind of rigor immediately after they’ve taken a three- to four-hour standardized exam seems cruel.
I have encountered a couple of problems with formative assessments. Students are not used to it, so it takes a while to get them into new habits. Beyond that, it does take more time. It is worth it, but the school wants every class to be teaching the same thing each day. That makes it difficult to pace based on the formative assessment.
I think that it is fairly easy to administer a formative assessment, but it is more difficult to find the time to re-teach. I have limitations based on when my cooperating teacher wants to begin teaching again and how long she thinks that these units should take.
The most significant barriers to performing more formative assessment is time constraints. In my student teaching placement we participate in PLC [Professional Learning Community] groups and all classes are required to do the same thing each day. In addition we only have a certain amount of days to get through a lot of material so there is not always time to get formative assessments done and get the material in as well.
The pressure to keep moving coupled with a lack of dedicated time for correctives are significant barriers to engaging in the type of formative assessment that was modeled for the participants. The participant preservice teachers also noted issues with what to do once they had the formative assessment data. In other words, if corrective action was needed, what should be done instructionally, how should they deal with the situation when the achievement is diverse, and how do these interventions interact with the pacing issue? The following are some examples from the presession survey. (Again, all statements come from different respondents.)
I struggle with what to do after the formative assessment. I have trouble deciding what is the best way to give the information again if students did not comprehend it.
Providing material for students who understand the concept on the first try while I work with students who need the extra help.
Time is always a factor. It’s hard to cover material and have time for students to practice as much as I’d like them to. Also, when you give a formative assessment, it’s hard when most of the class understands it and a few don’t. Do you move on and try to get in touch with those few students later? Or do you take the whole classes’ time to go over the assessment in depth.
Re-teaching takes time. So much of the work I have put in has been organizing a class that flows and is predictable. Taking a single day out to re-teach some topics throws the whole plan out of whack.
Whether or not the participants are correctly interpreting the curricular policies, there was a consistent reaction among the participants to the existing policies in the school district where the majority of participants taught. Even when they found time for corrective action, many were unsure of how best to use the results. What emerged from the responses to these measures is that the way many schools are operationalizing formative assessment and the curricular policies are not in line with the development assumptions of how the software would be used.
Data Access to Student Assessments Is Supported by Color-Coded Dashboard Displays
One goal of this study was to determine if the CaseMate color-coded way of representing data was useful to teachers. The postsession survey was used to determine if the color-coded matrix was a feature that the participants perceived as having value.
Of the 42 participants who were present for the usability test, 28 returned the postsurvey related to the perceived usefulness of the CaseMate data dashboard display. All but one of these 28 rated the color coding as being highly desirable. The one participant who selected a minor positive influence thought it should have been ordered alphabetically so that she could “compare current grade to other grades,” presumably in her grade book. Many of the comments provided suggest that the color coding aided the speed and ease of looking at the data. Several excerpts from different students’ responses on the postsession survey follow:
Made it easy to see at-a-glance what performance was by item, by student and overall.
With the color shading I am able to quickly identify groups and patterns within the data. The binary notation seems to require that I retrain myself to decipher the 1’s and 0’s every time I see them. The time saved over the course of a year by using the color notation would be immense.
I could immediately distinguish possible discriminators. Establishing ranges. Also helps in categorizing data. It’s something I’d probably end up doing with highlighters anyways.
The perceived utility is a crucial element in the adoption of any new innovation (Rogers 2003), so this particular finding was encouraging. Of course, innovations are often adopted and reinvented in ways not intended by the designers, so the next focus of the analysis was examining what decisions participants made based on the available data.
Data Interpretation Varies Widely: A Hodgepodge of Heuristics Exists
Although the benefits of data access for analysis were clearly articulated by the participants, the interpretation of those data varied widely, when the results of the participants’ analytic tasks were examined. Recall that in the first data set preservice participants looked at an assessment with 10 items. The matrix for this assessment is shown in Figure 2. When asked if their teaching was effective, 21 participants indicated that instruction was not effective, 13 participants indicated that it was effective, and eight participants indicated that it was somewhat effective. The same evidence was often given to support opposite interpretations of teaching effectiveness, as exemplified in the following quotes from two students on the data analysis task response sheets:
Yes, look at overall % of students that got each question correct. Only 4 questions received failing scores (out of 10). The grades are not very good, but more did well/average than poorly.
No, there were six questions in which the success rate was over 70%. Leaving four questions at a failing rate.
These results illustrate the confluence of teacher perception that would need to be taken into account when trying to promote the use of formative assessment in classrooms. Convincing teachers to make data-driven decisions and giving them tools to help them may be necessary, but it is not sufficient to ensure that they make appropriate data-driven decisions. The evidence presented is still filtered through the teacher.
The migration to a DDDM paradigm requires schools and teachers to move from a mindset of “providing instruction as deliverable” to a mindset of “producing results as deliverable.” The rationales and levels used to determine success were varied amongst the participants. The following excerpts from the data analysis task response sheets illustrate this point:
Yes, about 70% of the class got above average on the assessment. There were a few weak points that need re-teaching (#4, 7, 8, 10). But the other six questions had above 70% correct. The entire class understood at least 50% of the material.
Yes, almost all students picked up on the simple questions. Some re-teaching could take place to address more complex topics, particularly item 8.
Yes, my teaching was moderately effective. While there were a majority of students who failed, there was almost an equal # who passed. With the exception of #7 and #8 the majority of the class got the other questions.
No, 15 out of 19 students did not have 80% proficiency, which is mastery
My teaching was not that effective. The average score was around 60-65%. Also, as the questions became more cognitively complex the overall scores became drastically worse (more so than would be expected) indicating the tougher concepts were not taught well.
No, because less than half the class got a 70 or above.
Some participants employed simple heuristics for answering the questions, while others gave a more nuanced response. Cut-offs for acceptable teacher performance ranged between 50% and 80%. The data suggest that student motivation plays a role in how the participants determined when they had held up their end of the bargain. In response to the presession survey question about barriers and difficulties with formative assessment, 24 of the 46 respondents indicated student motivation related issues as barriers to the use of formative assessment.
Students failing to complete the work or participate. Several students choose not to complete any assignment no matter what. If the assignment is formative or summative does not matter, they choose over and over to simply not do any work.
Many students sleep or consistently skip class, it is hard to formatively assess students who are not present or do not care about the material being taught. Also, many students just want to see the answer and do not care to answer what you are asking.
Students not wanting to participate because they don’t receive a grade.
Many of those who failed to learn the material the first time will not learn it the second or third time… I feel like they do this in spite. When the students know it is a summative exam, they actually study, prepare and apply themselves. I sometimes believe that the results of the formative assessments are skewed.
During their formative experience in the classroom, a number of these participants have determined that assigning a grade is absolutely necessary to get students to take an assignment seriously and even then, it may not be effective. In the previous finding, the lack of using the results to guide corrective or enrichment activities was discussed. The participants gave a number of reasons for not being able to integrate these types of activities regularly into their curriculum. The question then raised for the researchers was, “Why would students take a formative assessment seriously if it not being used to guide instruction?” It is not difficult to imagine how easy it is for a student teacher to get caught in a vicious cycle of using the grade as a stick to get students “motivated” until assessment becomes strictly an adversarial activity.
Significance
Transitioning from the university lab setting brings with it a number of unforeseen factors. Despite the positive feedback on the usefulness of the system, there are significant hurdles to be overcome if it is be used in the manner that the developers envision to support robust use of formative assessment in classroom assessment. Applications like CaseMate have the potential not only to support teachers as they deploy robust instructional techniques, but to give schools of education a window into the classrooms of the teachers they prepare. Being able to link K-12 pupil performance to individual instructors and their interventions is a catalyst that has tremendous applications for mentoring, program evaluation, and research.
This type of catalytic potential can only tapped if teachers authentically use these tools in their practice. The findings of this study point to some serious but addressable impediments to the deployment of DDDM in classrooms. Despite the bleak history of impact in education, the power and availability of information management technologies has never been greater. The literature base on DDDM, as well as other related fields like Knowledge Management and Organizational Learning, acknowledge technology as a necessary, but insufficient condition for a robust implementation.
If DDDM is to have any success in a school the building and district leadership must manage the change process. Policies, both explicit and tacit, must be examined and reshaped so that they have the intended outcome. School leaders must also build a shared vision or understanding of how data are used. The third finding in this study illustrates that data are still filtered through the perspective of the individual. Each applies their own expectations, judgments and experience to the interpretation of data, with varied and, in some cases, opposite conclusions.
While the participants in this study found the tool beneficial for processing the data, the conclusions drawn were still based on individual definitions of success. The model of formative assessment that the software was designed to support may be unlikely to occur in the schools where the participants were placed due to curricular constraints and limited financial or staff support. This is not to say that the software could not be used to support what the schools were doing in terms of the techniques being promoted. Even if the software were able to allow teachers to implement these techniques in a more efficient manner, there is no guarantee it would result in a robust implementation of formative assessment.
Given the lack of formal planning for correctives, pacing pressures, and the adversarial nature of assessment, an optimal outcome is unlikely. The notion of technology as catalyst (McDonald & Ingvarson, 1997) is an apt analogy for the role of information technology in facilitating DDDM. Catalysts change the rate of a process/reaction rather than the products. Schools are complex organizations where many reactants are present, and technologies that are supposed to impact one aspect may also affect other processes leading to unintended consequences.
Just as crucial to the success of instructional improvement is the policy infrastructure that will guide how teachers deploy that technology. In the same way we are expecting teachers to adjust their instruction, administrators should monitor the effect their policies are having on classroom practice and adjust them accordingly. Educational leadership must facilitate the creation and maintenance of environments that provide the right drivers, accountability, and support to enable teachers to move to practice rooted in DDDM.
The literature in school improvement speaks to the need for continual adjustment. Newmann, King, and Youngs (2000) described five elements of school capacity: (a) Knowledge, skills and dispositions of individuals, (b) Professional community, (c) Program coherence, (d) Technical resources, and (e) Principal leadership. Newman, Smith, Allensworth, and Bryk (2001) extended this framework and argued that coherence should guide school improvement efforts. A coherent program should be one where the goals, interventions, measures, and other aspects of the school operation are in alignment. A collection of interventions that may not interface well can be just as ineffective as doing nothing at all. If technology is to be a catalyst for the change desired in schools, the school leadership must put the correct reactants in place to ensure that the desired products are achieved.
Teacher educators need to be part of the alignment process. Although teacher educators can play an essential role in developing the skills necessary to allow DDDM to work at the classroom level, it is necessary to partner with schools so that the skills preservice teachers learn in their programs can be deployed. We are currently partnering with schools to introduce CaseMate into classrooms via our student teachers.
For example, in the elementary methods course, students took an assessment on plant growth. During their practicum visit they each interacted with three elementary students, each of whom also took the assessment. During the next class session, the results were reviewed and analyzed using the person-by-item displays to provide them with concrete examples of how technology can be used to facilitate formative assessment. This is a beginning attempt to help them “see examples of what doing better means in practice” (Black & Wiliam 1998, p. 146). In one of the technology electives offered, students teachers create “cases” that they use during their teaching placements. Our hope is to construct the “living examples of implementation, as practiced by teachers” with whom other teachers can identify (p. 146).
Like many of its sister fields, such as knowledge management, DDDM implementation is reliant on technology but requires many other components to be successful. The amount of data produced on a daily basis in any educational environment is beyond the information processing capabilities of the educators in that environment. Working with K-12 partners, teacher education can be actively involved in the design and study of tools that facilitate more robust implementation of practice. By reducing the administrative and cognitive load tasks associated with robust practice. Educators and students can “think harder about the subject matter domain being studied or the task being undertaken and to generate thoughts that would be impossible without these tools” (Jonassen & Reeves, 1996, p. 697).
References
Argyris, C., & Schon, D. (1978) Organisational learning: A theory of action perspective. Reading, MA: Addison Wesley.
Black, P., & Wiliam, D. (1998). Inside the black box: Raising standards through classroom assessment. Phi Delta Kappan, 80(2), 139-148.
Bloom, B. S. (1968). Learning for mastery. Evaluation Comment, 1(2), 1-12.
Bloom, B. S., Hastings, J. T., & Madaus, G. F. (1971). Handbook on formative and summative evaluation of student learning. New York, NY: McGraw-Hill.
Bowers, A. J. (2009). Reconsidering grades as data for decision making: More than just academic knowledge. Journal of Educational Administration, 47(5), 609-629.
Crouch, C. H., & Mazur, E. (2001) Peer instruction: Ten years of experience and results. American Journal of Physics, 69(9), 970-977.
Erikson, F. (2007). Some thoughts on “proximal” formative assessment of student learning. In P. Moss (Ed.), Evidence and decision Making, Vol. 106, No. 1: National Society for the Study of Education yearbook (pp. 186-216). Malden, MA: Blackwell Publishing.
Harnisch, D.L., & Linn, R.L. (1981) Analysis of item response patterns: Questionable test data and dissimilar curriculum practices. Journal of Educational Measurement, 18(3), 39-87.
Ikemoto, G. & Marsh, J. (2007). Cutting through the “data-driven” mantra: Different conceptions of data-driven decision making. In P. Moss (Ed.), Evidence and decision Making, Vol. 106, No. 1: National Society for the Study of Education yearbook (pp. 105-131). Malden, MA: Blackwell Publishing.
Jonassen, D. H., & Reeves, T. C. (1996). Learning with technology: Using computers as cognitive tools. In D. H. Jonassen, (Ed.), Handbook of research on educational communications and technology (pp. 693-719). New York, NY: Macmillan.
Lasry, N., Mazur, E., & Watkins, J. (2008) Peer instruction: From Harvard to the two-year college. American Journal of Physics, 76(11), 1066-1069.
Mcdonald, H., & Ingvarson, L. (1997). Technology: A catalyst for educational change. Journal of Curriculum Studies, 29(5), 513-528
Morgan, R. M. (1978). Educational technology: Adolescence to adulthood. Educational Communication and Technology Journal, 26, 142-152.
Morrison, G. R., Ross, S.M., & Kemp, J.E. (2007). Designing effective instruction. New York, NY: John Wiley & Sons.
Moss, P. (2007). Introduction: Evidence and decision making. In P. Moss (Ed.), Evidence and decision Making, Vol. 106, No. 1: National Society for the Study of Education yearbook (pp. 15-45). Malden, MA: Blackwell Publishing.
Newmann, F.M., King, M.B., & Youngs, P. (2000) Professional development that addresses school capacity: Lessons from urban elementary schools. American Journal of Education, 108(4)259-299.
Newmann, F.M., Smith, B., Allensworth, A., & Bryk, A.S. (2001) Instructional program coherence: What it is and why it should guide school improvement policy. Education Evaluation and Policy Analysis, 23, 297-321.
Patton, M. Q. (2002). Qualitative research and evaluation methods (3rd ed.). Thousand Oaks, CA: Sage Publications, Inc.
Rogers, E. M. (2003). Diffusion of innovations (5th ed.). New York, NY: The Free Press.
Scriven, M. S. (1967). The methodology of evaluation. In R. W. Tyler, R. M. Gagne, & M. Scriven (Eds.), Perspectives of curriculum evaluation (AERA Monograph Series on Curriculum Evaluation No. 1; pp. 39-83). Chicago, IL: Rand McNally.
Stiggins, R. (2004). New assessment beliefs for a new school mission. Phi Delta Kappan, 86(1), 22-27.
Wayman, J. C. (2005). Involving teachers in data-driven decision-making: Using computer data systems to support teacher inquiry and reflection. Journal of Education for Students Placed at Risk, 10(3), 295-308.
Wiliam, D. (2006). Formative assessment: Getting the focus right. Educational Assessment, 11(3-4), 283-289.
Worthen, B.R., Sanders, J.R., & Fitzpatrick, J.L. (1997). Program evaluation: Alternative approaches and practical guidelines (2nd ed.). New York, NY: Longman.
Author Information
Gerry Swan
University of Kentucky
Email: [email protected]
Joan Mazur
University of Kentucky
Email: [email protected]
![]()